Search results
Query: ui view map
Links: 20 | Categories: 0
-
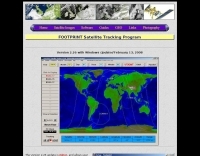 Footprint Satellite Tracker is a satellite tracking software that provides real-time monitoring of satellite movements worldwide. It features a global map with celestial markers and allows users to adjust time settings to predict satellite paths. Customizable options include location coordinates and time zones. Users can analyze satellite ephemeris and print reports, though file-saving requires a virtual printer. Despite its research utility, the software supports a limited satellite list and lacks options for manual data source connections. Current version has been tested running on Windows 10.
 -
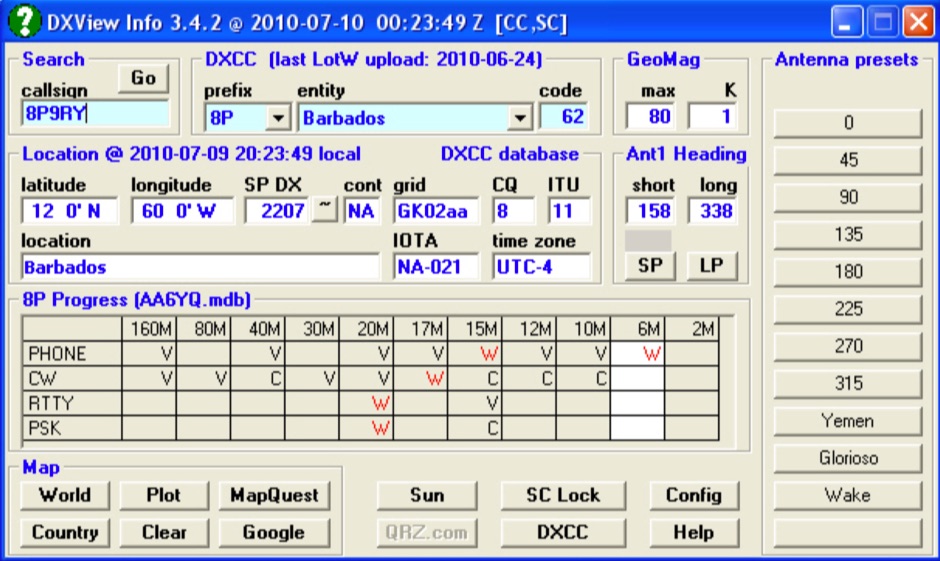 A free application that displays location information determined from a callsign, displays translations of common "QSO words and phrases" in the languages used in the callsign's DXCC entity, displays beam headings and SpotCollector DX Spots on a world map, displays country maps, and provides point-and-click control of antenna rotators from AlfaSpid, ARSWIN, Heath, Hygain, M2, Prosistel, SARTek, TIC, Trackbox, and Yaesu
 -
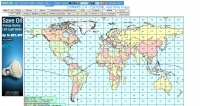
 A large jpeg DX World map that include ITU Zones, grid squares and prefixes. This high-resolution DX World Map is an essential tool for amateur radio operators. It clearly displays ITU zones, CQ zones, grid squares (Maidenhead Locator), and DXCC prefixes, helping you to plan QSOs, track propagation paths, and participate in global contests. Whether you are a seasoned DXer or a beginner, this map provides a clear, detailed view of the radio world, improving your station's efficiency and geographic awareness. Available in JPEG format, it's perfect for display
 -
 DXMaps.com presents a dynamic, real-time mapping service for amateur radio DX spots, integrating data from traditional DX clusters, _PSK Reporter_, and WSPR networks. The platform visually plots global QSO and SWL activity, enabling users to observe propagation conditions across various bands, from 2200m to >450 MHz. It offers distinct overlays such as the magnetic equator, gray line, moon footprint for EME, and VOACAP propagation predictions, providing a comprehensive view of radio wave behavior. The service allows granular filtering of displayed spots, including options to show only DX-Cluster data, PSK Reporter activity, or WSPR signals. Users can refine the map view by selecting specific bands (e.g., 160m, 20m, 6m, 2m), limiting spots to the last 15 minutes, or displaying only contacts exceeding **2600 km**. Additional features include the ability to toggle grid squares, aurora forecasts, and various amateur radio zones (CQ, ITU). Distinctively, the resource updates automatically every minute, ensuring current propagation intelligence without manual refresh. It also supports specialized views for EME, ionospheric scatter, and aircraft scatter, alongside FM DX and APRS activity. The platform emphasizes the importance of accurate locator information in DX spots to enhance data quality and offers a user manual and FAQ for guidance.
 -
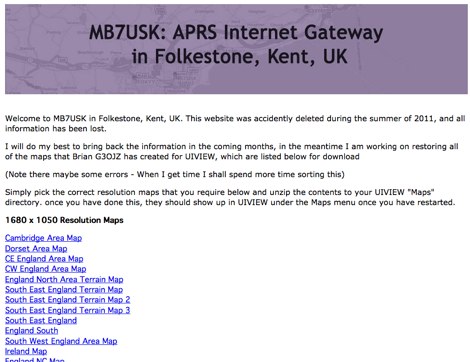
 Amateur radio programs to download, locator , log, etc... for Psion Aprs maps for PC (ui-view)
 -
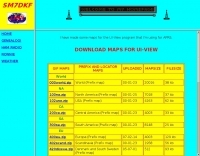 some maps for the UI-View program that SM7DKF is using for APRS
 -
 TAHO.EXE, an open-source software, facilitates the creation of APRS maps for _UI-View_ by converting free data from _OpenStreetMap_ into the required *.JPG and *.INF file formats. This utility, developed by Dimitri Junker with specific UI-View format support added at the request of HB9DTX, streamlines the process of integrating detailed geographical information into the _UI-View_ platform. It operates on Windows, generating map files with border coordinates in just a few clicks, eliminating the tedious manual creation of *.INF files for custom maps. This converter allows UI-View users to leverage the continuously updated and community-contributed data of OpenStreetMap, which often surpasses commercial map quality in specific regions. The process is straightforward, with a detailed step-by-step guide available on the OpenStreetMap wiki, translated into French and German. TAHO.EXE significantly enhances the utility of UI-View by providing a readily accessible and continuously improving source of detailed, current geographical maps for displaying APRS station positions and objects.
 -
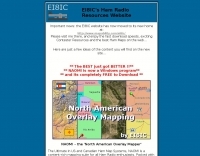 Over 47 full-screen maps are available within _NAOMI_ (North American Overlay Mapper), a free Windows program designed for US and Canadian amateur radio enthusiasts. This mapping suite includes 9 backgrounds such as CQ Zones, ITU Zones, and ARRL Sections, along with 16 foreground layers like Counties, Areacodes, and Grid Locators. Users can calculate distances and bearings, track real-time mouse positions with continuous Grid-Locator data, and integrate with APRS for live station tracking via the FindU database. For a global perspective, the _Global Overlay Mapper_ (GOM) provides a world map, 8 continental maps, and 29 sub-continental maps, all with 12 active layers including Country Outlines, CQ/ITU Zones, and Prefix information. Both NAOMI and GOM offer feature-locate systems to jump to positions based on prefixes, capital cities, or Grid Locators, and provide customized beam headings and distance displays. The site also features _LogView_, a post-contest log visualization tool that analyzes Cabrillo-format logs by plotting QSOs on maps, supporting over 30 major contests like CQWW and ARRL DX, and allowing comparison with published results.
 -
 Displays amateur radio grid squares worked from third-party logging programs, providing a visual representation of contacts on a world map. This Windows application uses colors to differentiate up to four bands concurrently, calculating the total number of grid squares worked per band. It reads plain-text log files, including fixed-width, character-delimited, ADIF, and Cabrillo formats, dynamically updating the map as log files are saved during contests or general operation. Primarily targeting **VHF** and above operators, WorkedGrids aids in grid square collection for contesting and awards. The software offers a fixed-resolution continental viewpoint, zoom-in capabilities, and supports printing or copying the map to the clipboard. It operates on Windows 95 through Windows 11, requiring minimal CPU and RAM, and features a non-invasive installation. The program has undergone several updates, with version 7 released on March 3, 2024, addressing minor fixes and improving stability.
 -
 The 3Y0K Log Online provides a detailed logsearch interface for the **3Y0K** DXpedition to Bouvet Island, scheduled for February 2026. This web-based tool, hosted on _Club Log_, allows users to access real-time QSO statistics and leaderboards. The interface includes interactive features such as a map for checking real-time propagation and colored boxes that reveal mode and time breakdowns when hovered over. The service supports HF bands and provides a structured overview of QSOs, including band/mode breakdowns and continent-specific data. Users can report logging inquiries and QSL requests exclusively through the M0OXO Online QSL Request System (**OQRS**). The site also offers additional resources like band plans, operating practices, and FT8 advice. The leaderboard feature, which includes clubs and Contest Club, ranks stations based on the number of band slots worked, with duplicate QSOs being discouraged. The expedition's impact on users' totals is also tracked, providing insights into new bands, modes, and DXCC entities worked. DXZone Focus: 3Y0K DXpedition | Club Log | Bouvet Island
 -
-
 Presents the Holy Cluster, a contemporary DX cluster service offering real-time amateur radio spot data. This platform integrates a dynamic graphical map to visualize current contacts, enhancing situational awareness for DXers and contesters. Developed by an Israeli group of developers and supported by the Israeli Association of Radio Communication (IARC), the Holy Cluster aggregates DX spots from various sources, including traditional telnet clusters, the Reverse Beacon Network (RBN), and PSK Reporter, providing a comprehensive view of band activity. The cluster's design emphasizes a user-friendly interface for monitoring DX activity across multiple bands, including dedicated support for JOTA (Jamboree On The Air) operations. Its aggregation capabilities allow operators to quickly identify propagation openings and active stations, streamlining the process of making two-way radio contacts. The integration of RBN and PSK Reporter data offers insights into propagation conditions and station reception reports, which can be invaluable for optimizing antenna direction and operating strategies.
 -
 A 2x3-foot laminated world map product is detailed, offering customization for amateur radio operators. Each map features two distinct views: one centered on the operator's specific station location and another precisely centered on its _antipode_. Countries are clearly labeled, complemented by a tabular listing of all countries. The map integrates a standard latitude/longitude grid alongside concentric circles that delineate distance increments radiating outward from the operator's QTH. Personalization includes the operator's name, callsign, and location printed directly on the map. This custom mapping service provides a unique visual aid for DXing and propagation analysis, allowing operators to quickly ascertain beam headings and distances from their station. The dual-view presentation, particularly the antipodal centering, offers a practical reference for understanding long-path propagation and identifying potential DX opportunities. The inclusion of distance circles and personalized station data makes it a tailored tool for daily operating and contest planning, distinct from generic world maps.
 -
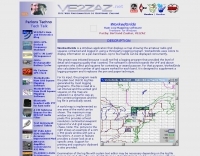
 Demonstrates the practical application of APRS (Automatic Packet Reporting System) through the lens of HB9PVI's activities in Switzerland. It covers the system's core function of reporting geographical positions and telemetry data from various objects, including mobile stations, aircraft, and the ISS, distributed via packet radio and internet gateways. The resource highlights the routing paradigm shift introduced in April 2005, specifically the recommendation to use _WIDE1-1_ instead of RELAY and WIDE for digipeating to reduce duplicate packets. The page presents real-time maps displaying the positions of amateur radio stations in Switzerland and around Bern, updated every few minutes. It details specific callsigns like _HB9BA-2_ (HB9PVI's home QTH), _HB9BA-8_ (a weather station), and _HB9BA-4_ (a WIDE digipeater on Weissenstein mountain), providing context for their roles within the local APRS network. Links to track HB9PVI's mobile operations (_HB9PVI-9_) and handheld devices (_HB9PVI-15_, _HB9PVI-7_) are also provided. Furthermore, the resource curates a list of APRS software options for various operating systems, including _JavAPRS_ for Europe, _UI-view_, and _X-Astir_ for Linux, alongside digipeater/IGATE software like _DiXPRS_. It also offers downloadable APRS information, including a PDF article by HB9PVI and HE9ZGN, and a PowerPoint presentation in German, making it a repository of practical and historical APRS data.
 -
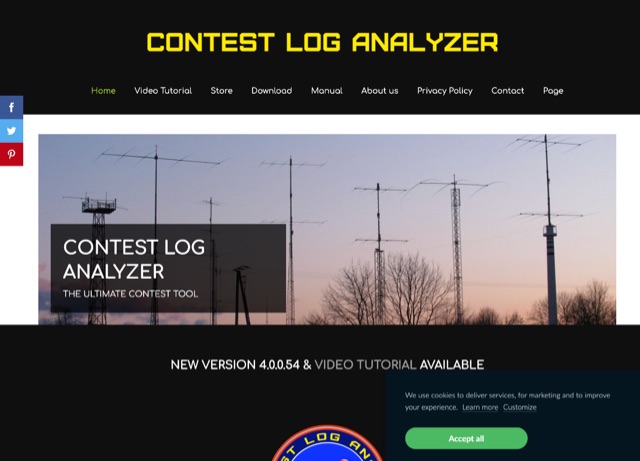 The complete software suite to Edit, Analyze, Generate Statistics, View multiple logs simultaneously, Map QSOs, Import and Export to Cabrillo or ADIF files. The Contest Log Analyzer has been developed as a complete database management application, where you can create separate Databases, containing several Logs, a convenient way to save, in one place only, all your log files that accumulate over the years. It runs on Mac and Windows, and it is a commercial product.
 -
 Spotty leverages Philip Gladstone’s pskreporter.info data, delivered via an MQTT broker by Tom Fanning (M0LTE), to offer a responsive web application for visualizing propagation. The Map View presents a default visualization (grid AA00 / callsign MY8CALL) and distinguishes signal types: small spots for signals heard by a location, large spots for transmissions from a location, and teardrop markers for transmissions from the monitored callsign. Clicking a spot reveals detailed signal data in an overlay. The application includes a Log View for raw spot data and a Settings tab for customization. Users can filter tracking by specific Callsign or Grid, with preferences saved to the browser. A notable feature is the Time to Live (TTL) setting, adjustable from the default 60 seconds, which controls spot visibility duration to manage map clutter during high-traffic periods. The tool provides a clear, logic-driven interface for real-time signal monitoring.
 -
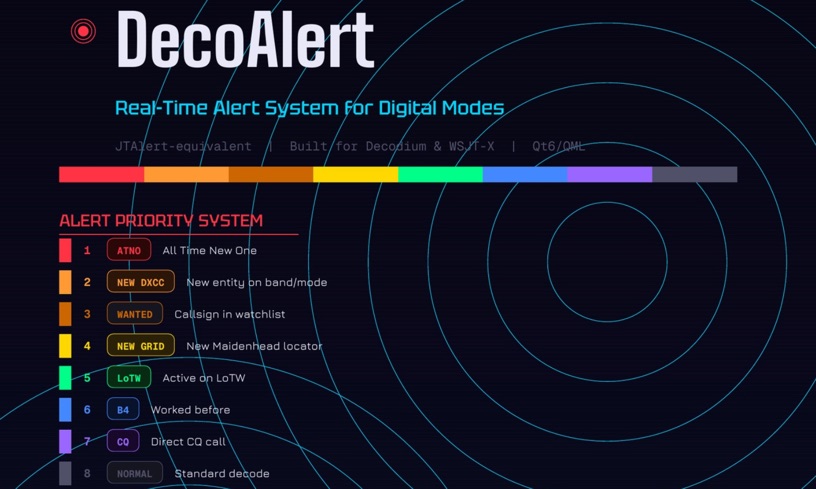 DecoAlert 1.0 Beta is a companion application designed to enhance the digital mode operating experience, specifically for FT8, FT4, and FT2. It operates by monitoring UDP data streams from primary decoding software like _Decodium_ and _WSJT-X_ on port 2237. The software provides real-time, priority-based audio alerts using WAV sounds for various conditions, including All Time New Ones (ATNO), new DXCC entities per band/mode, user-defined watchlist callsigns, new Maidenhead grid squares, and LoTW-active stations. It also highlights previously worked stations (B4) and integrates live DX spots from Telnet clusters, offering a comprehensive suite of tools for serious digital mode operators. The application features a built-in SQLite database for tracking worked stations and integrates with LoTW user lists to identify confirmed contacts. A DX Cluster client supports multiple Telnet servers, providing a broad view of propagation. PSKReporter statistics are available by band and mode, offering insights into signal paths. The QSO log viewer includes search and filter capabilities, while an _OpenStreetMap_ (OSM) interface visualizes spot locations, aiding in situational awareness. DecoAlert requires Windows 10/11 (64-bit) and compatible digital mode software configured to send UDP data.
 -
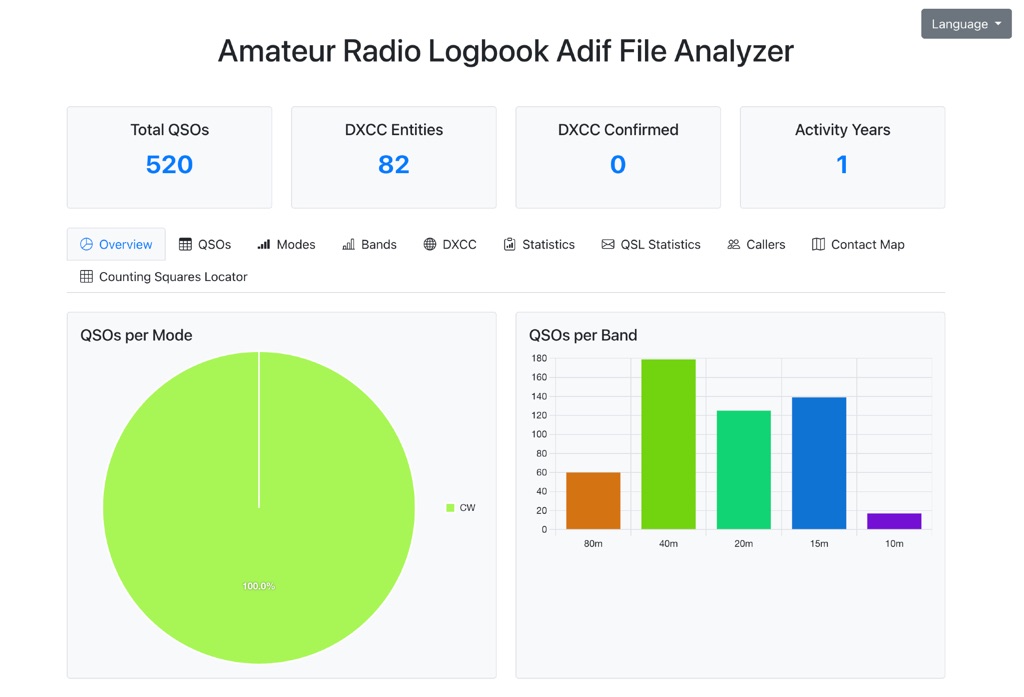 The Amateur Radio Logbook ADIF File Analyzer available at loganalyzer.sv5fri.eu is a convenient web-based tool that allows you to upload your ADIF log and instantly generate a visual map of your QSO contacts along with detailed statistics—by band, mode, time, grid squares, DXCC, and more. It provides an intuitive overview of your operating patterns and performance without requiring any software installation.
 -
 This article published on QEX details measurements of tree conductivity and permittivity at HF frequencies, addressing a long-debated topic in amateur radio. N6LF conducted experimental impedance measurements on Douglas fir and maple trees using a vector network analyzer with rings of nails inserted into tree trunks. Results showed that tree conductivity increases with frequency while relative permittivity decreases, similar to soil characteristics. Measured conductivity ranged from 0.06 to 0.4 S/m at 10 MHz, aligning with values used in previous research. These findings validate that NEC modeling can reliably estimate trees' substantial impact on HF antenna performance.
 -
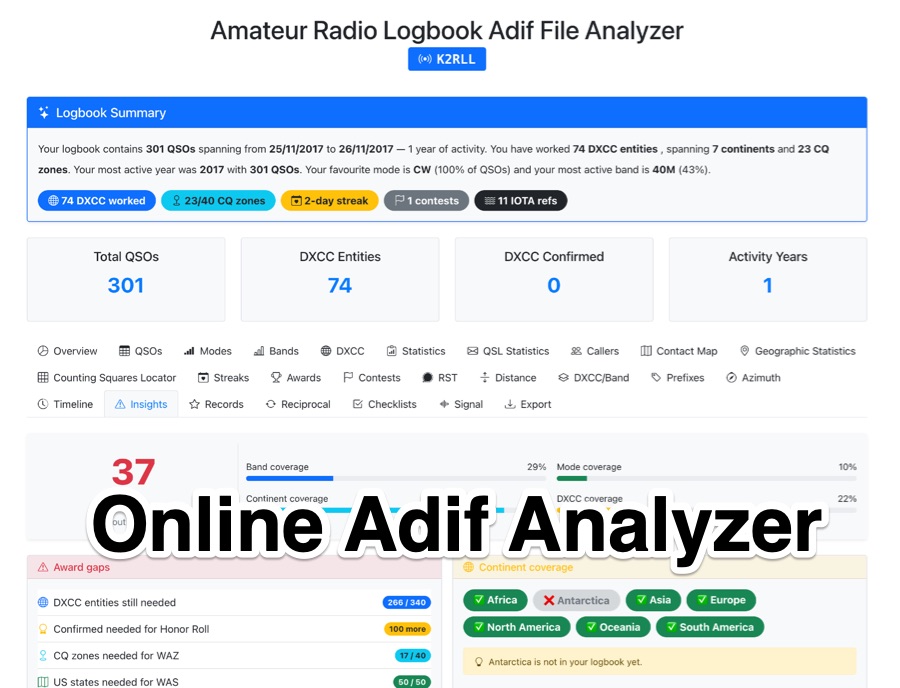 The _Amateur Radio Logbook ADIF File Analyzer_ processes ADIF files locally within the user's browser, ensuring no QSO data is uploaded to a server. It generates a visual map of contacts and detailed statistics across various parameters, including band, mode, time, grid squares, and DXCC entities. The tool offers insights into operating patterns and station performance without requiring any software installation. Users upload their ADIF log files directly, and the analysis is performed client-side, providing immediate results. The output includes charts and graphs that visualize QSO distribution and activity. This approach prioritizes user privacy and data security, as logbook information remains on the user's computer throughout the analysis process. The analyzer supports standard ADIF formats, enabling hams to quickly review their log data for trends and achievements. It is a free, open-source utility designed for general amateur radio log analysis.