Search results
Query: plot
Links: 68 | Categories: 0
-
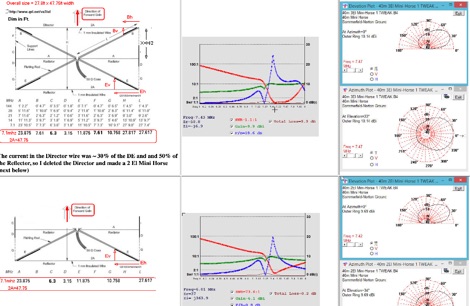 This page describes a comparison study on seven different beam antennas for 40 meters band. Yagi antennas, moxon antennas, mini horse all antennas are described with schema diagram , azimuth plot and SWR F/B Gain diagram
 -
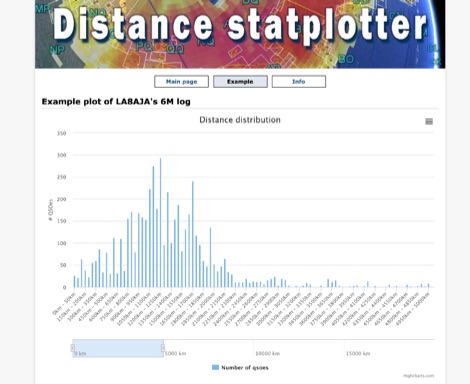 You can upload your adif-file It then checks the qso for specified band and if a maidenhead locator is specified. It then builds an array and plot a graph.
 -
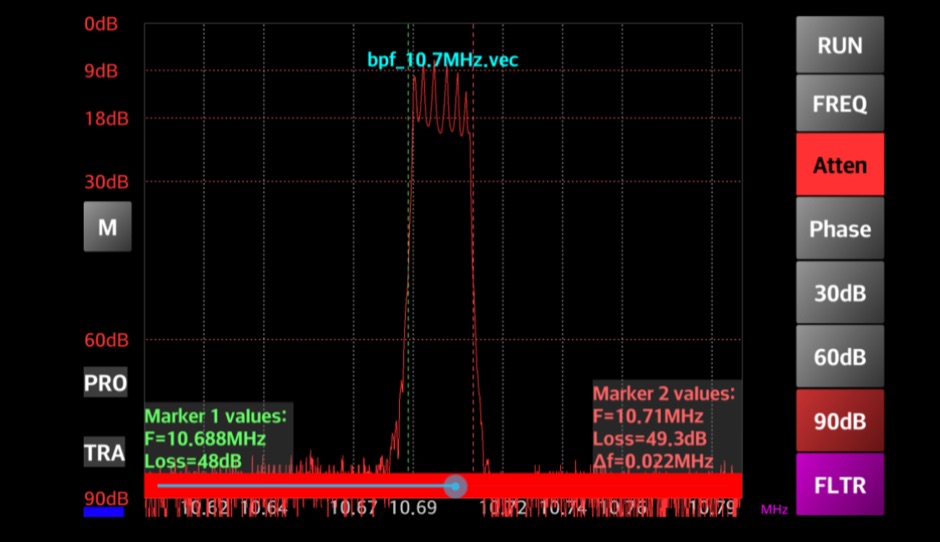 Enables Android users to operate various _miniVNA_ antenna analyzers via Bluetooth, USB, or Wi-Fi, providing a portable solution for RF measurements. The application supports full control over data acquisition, offering features like custom frequency range selection from 1 KHz to the VNA's full range, and automatic screen adaptation for diverse Android device resolutions. It facilitates intuitive, wizard-based calibration for both reflection and transmission modes, saving calibration data for different VNA types (Standard, Pro, Pro with Extender) to avoid repeated procedures. The software displays critical parameters such as SWR, |Z|, Return Loss, Phase, Rs, and |Xs| on 2-axis graphs or Smith charts, with multi-touch gestures for zoom and frequency shift. It includes a frequency generator mode with independent channels and attenuator control for the miniVNA Pro, along with a sweeper function. The cable data mode automatically calculates phase and loss, measures cable length from less than 1 meter to hundreds of meters, and includes a table of common coax cable velocity factors. An experimental X-tal mode measures resonance frequency, Rs, and Q. Data export options include CSV, ZPLOT, and S1P formats, with CSV import capability. The application also features an SM6ENG Audio mode for SWR tuning without visual reference and provides a miniVNA battery voltage indicator. It supports a wide frequency range, with the miniVNA Extender extending coverage up to **1500 MHz**. The application is compatible with Android version 2.2 and later, tested on devices like the _Galaxy TAB 7.7 P6800_.
 -
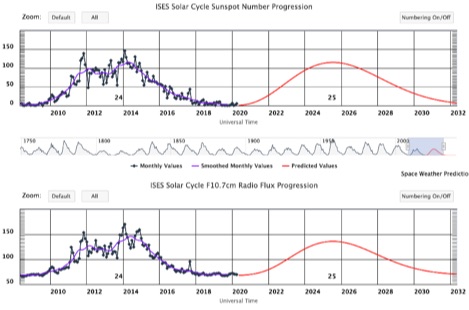 A dynamic graph of current and past solar cycle sunspot number progression and F10.7 cm radio flux progression. In both plots, the black line represents the monthly averaged data and the purple line represents a 13-month weighted, smoothed version of the monthly averaged data.
 -
 Time Mapper UHD is a versatile mapping and time visualization program offering multi-satellite viewing with frequency display and unique country-pairs for PskReporter data. It features live feeds from logging programs and can plot ADIF files. Ideal for schools, offices, or amateur radio stations, it provides customizable 4K or HD world clock displays with over 60 map layers, including ham radio zones and natural features. The program supports various time functions and can import logs for detailed analysis. It runs on Windows 10 or 11 and offers a 30-day free trial.
 -
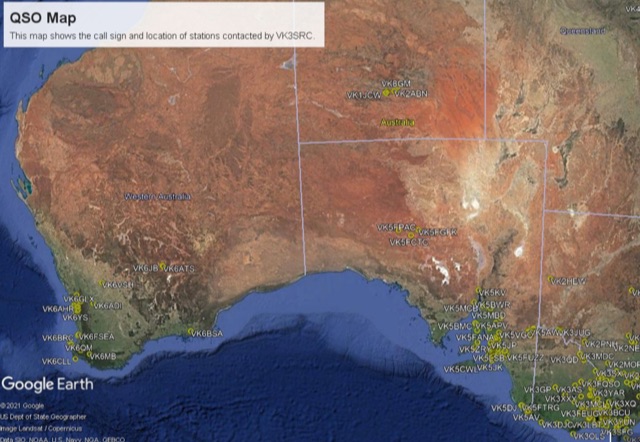 This project is a python program used to plot the location of QSOs (radio contacts) on Google Earth or other mapping applications. It reads an ADI file of the QSOs and creates a KML file
 -
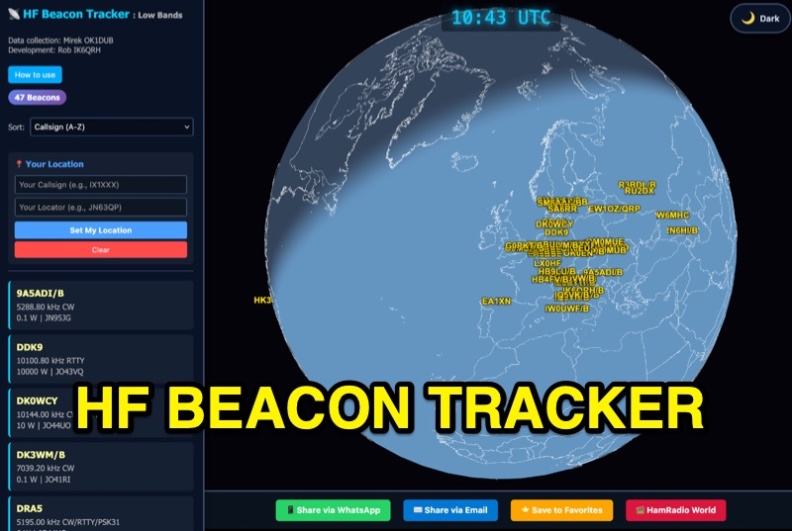 The HF Beacon Tracker is an advanced interactive tool designed for DXers and ham radio opoerators in general to monitor active beacons operating below 14 MHz. Built upon a high-fidelity 3D Earth globe, the application provides a spatial perspective on signal paths by integrating real-time environmental data with a comprehensive beacon database curated by Mirek OK1DUB. Beacons are plotted using precise Maidenhead locators and feature a real-time day/night terminator overlay to help operators identify Gray Line propagation opportunities. With a single click, users can calculate the exact distance from their own QTH to any beacon, visualized via an animated Great-Circle Path arc on the globe surface. To enhance its diagnostic capabilities, the tool seamlessly integrates with PSK Reporter, allowing users to right-click CW beacons to instantly fetch current reception reports and signal strength data. The interface is fully optimized with a mobile-responsive design, smooth globe rotation, and togglable Dark/Light themes suitable for any shack environment. Whether you are performing antenna gain tests, conducting ionospheric research, or simply hunting for band openings, the HF Beacon Tracker transforms raw database information into an intuitive, visual diagnostic suite. It serves as an essential asset for any operator looking to master HF band conditions.
 -
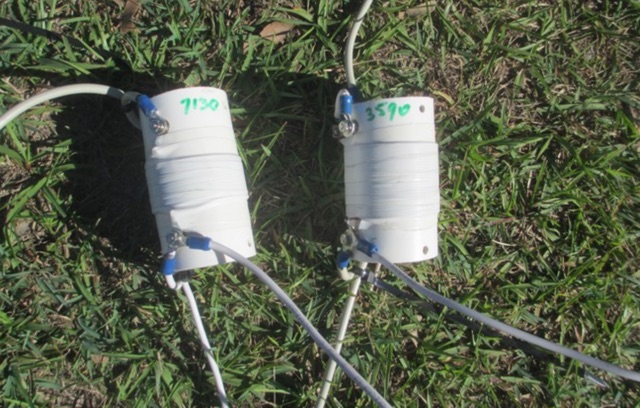 A Trapped dipole inverted V antenna for lower HF Bands. Construction details are for temporary installation. Permanent installations will require additional ruggedising and waterproofing however the basic electronics concepts remain the same. This project includes SWR plots for the three bands and pictures details of the homemade traps.
 -
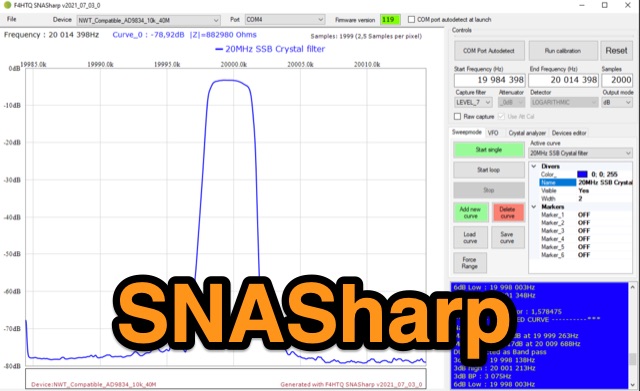 SNASharp is a free software application designed to work with scalar network analyzers compatible with NWT software from DL4JAL. It is used to measure and analyze the scattering parameters (S-parameters) of microwave devices. Provide several measurements and analysis tools including Smith chart, Polar plot, S-parameter tables, Transmission line calculator
 -
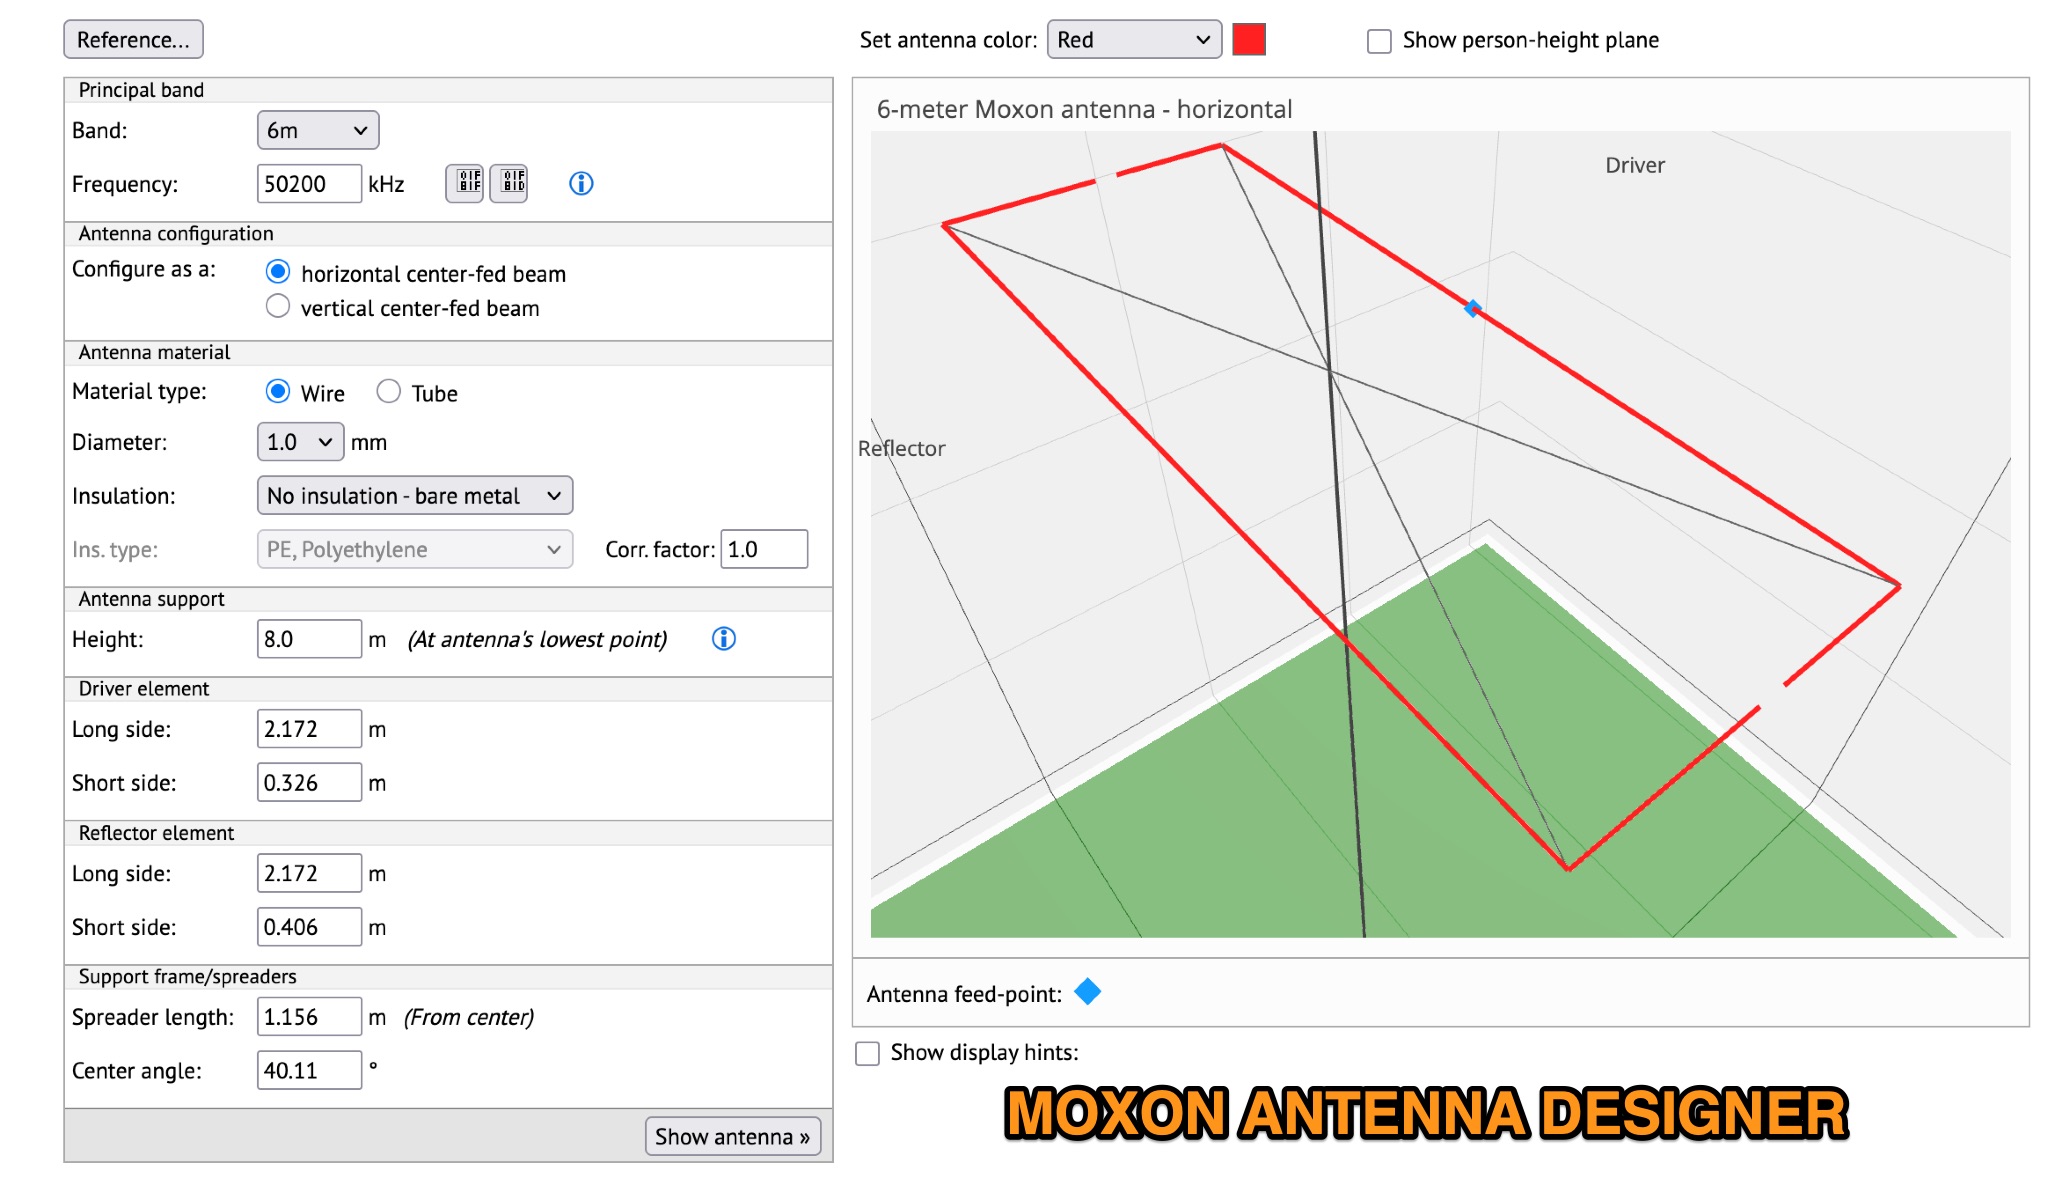 This page provides information on designing a lightweight Moxon antenna for the upper HF bands and VHF. The Moxon antenna is a compact version of a 2-element Yagi with folded elements, offering good forward gain and a high front-to-back ratio. It is designed for a single band with a feed-point impedance close to 50 ohms. Hams can orient the antenna horizontally or vertically, with polarization following the configuration, affecting radiation patterns. The page allows users to generate radiation pattern plots, VSWR charts, antenna currents diagrams, and Smith charts for their antennas on different ground types, helping them understand antenna performance in the field.
 -
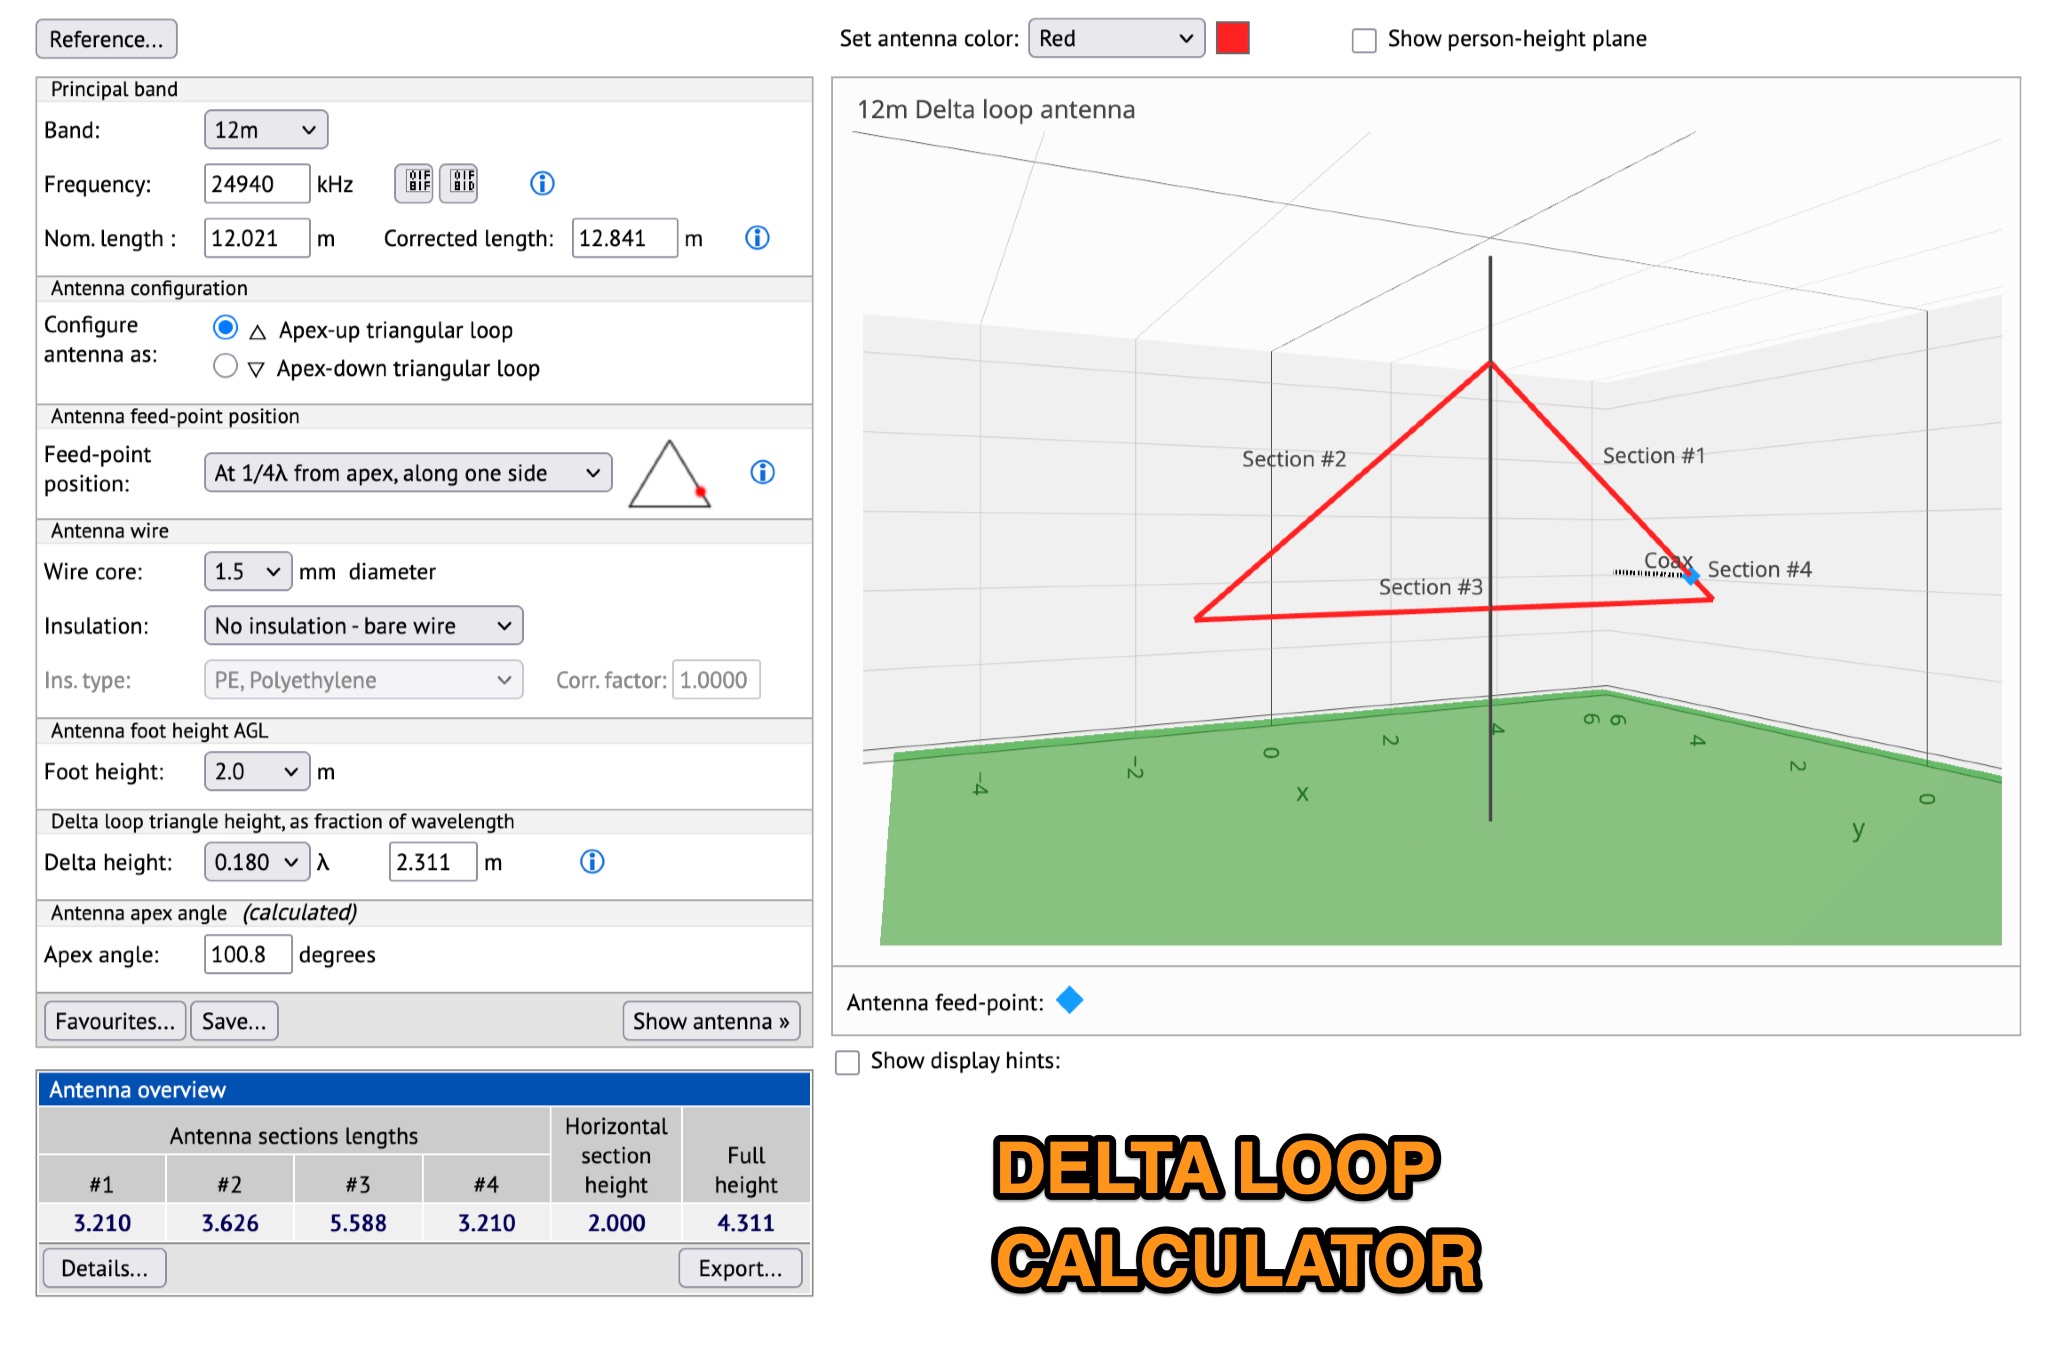 This page allows hams to design a vertical-plane delta-loop antenna for a single amateur HF band in different configurations. By choosing different feed-point positions, operators can observe variations in polarization properties, radiation patterns, and feed-point impedances. Users can generate radiation pattern plots, VSWR charts, antenna current diagrams, and Smith charts for their antennas over various ground types. Through adjusting the antenna's physical dimensions and refreshing the plots, hams can gain insights into the antenna's performance in the field. The page also discusses how elevation radiation patterns may change based on the antenna configuration and feed-point position.
 -
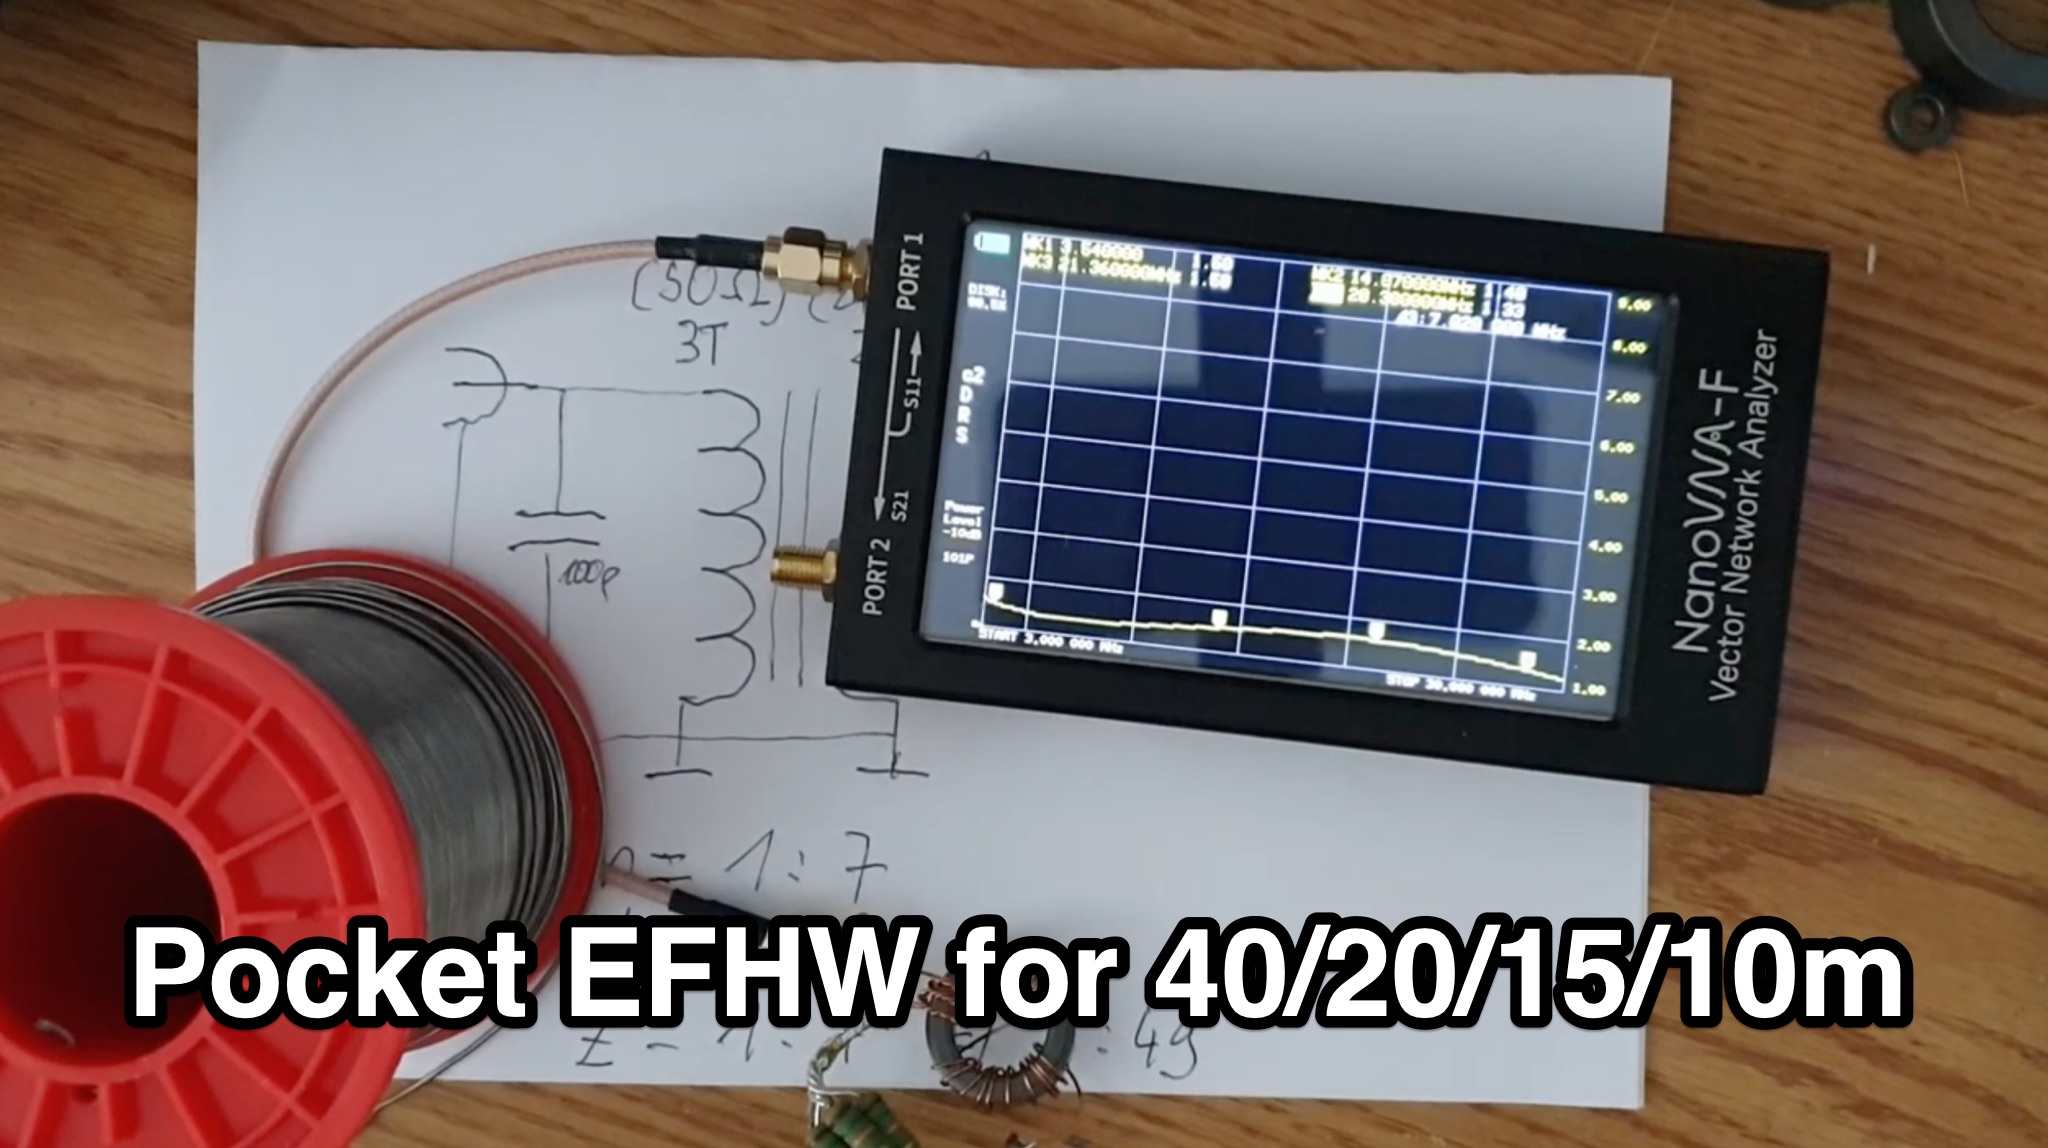 The Portable EFHW antenna for the 40, 20, 15, and 10-meter bands utilizes a broadband transformer with a 1:49 ratio, designed on a PCB by either Jan or DL2MAN. The design incorporates an **FT114 core**, offering an alternative to the FT82 core. The antenna requires precisely 20.5 meters of DX Wire Ultralight for optimal performance. Additional components include DX Wires "Dyneema" 1mm rope and 1mm bricklayers string for structural support. The SWR plot indicates performance at two elevation heights: 5.5 meters (blue line) and 4 meters (yellow line), demonstrating optimization for low-elevation portable use without poles. The antenna's components, including spool and rope tensioners, are available for 3D printing, with spool dimensions scaled to 130% for a length of approximately 110mm. The design emphasizes simplicity and portability, suitable for field deployment.
 -
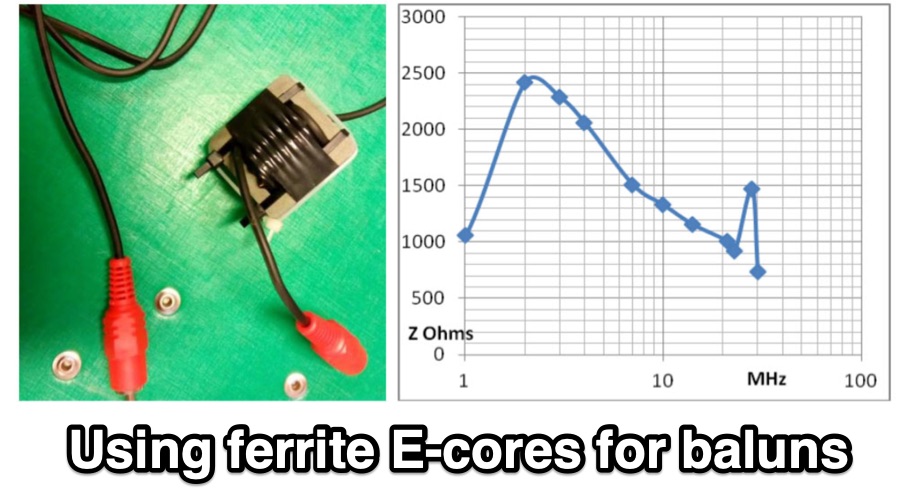 Ferrite E-cores offer a practical solution for constructing baluns, especially when connectors are already mounted on cables. These cores, commonly used in mass-produced pulse transformers, allow for multiple turns without dismounting connectors, making them ideal for control and power supply cables. The material of E-cores is generally suitable for common mode baluns up to 15 MHz, providing a cost-effective option for amateur radio operators. E-cores can often be sourced from old switch-mode power supplies, adding to their appeal for those looking to utilize existing resources. A notable example involves a balun on a USB cable using a Ferroxcube E 32x16x9, 3F3 core with four turns, secured by three cable ties. This setup demonstrates the ease of construction and stability achievable with E-cores. Another example features a balun with eight turns of shielded cable with RCA connectors on the same core, achieving 140 uH inductance at low frequencies. The impedance plot for this configuration is measured between the shield ends, illustrating the effectiveness of E-cores in practical applications. The article includes detailed figures and descriptions, providing valuable insights into the construction and application of baluns using ferrite E-cores. These examples serve as a guide for amateur radio enthusiasts looking to enhance their setups with cost-effective and efficient solutions.
 -
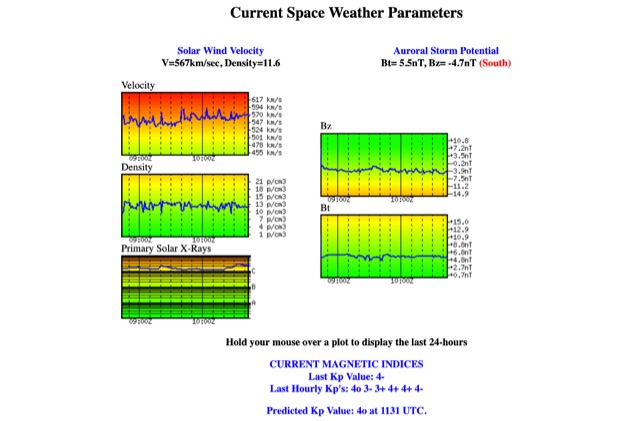 Solar Wind Velocity and Auroral Storm Potential the website provides also current magnetic indices like last Kp values and predicted Kp values.
 -
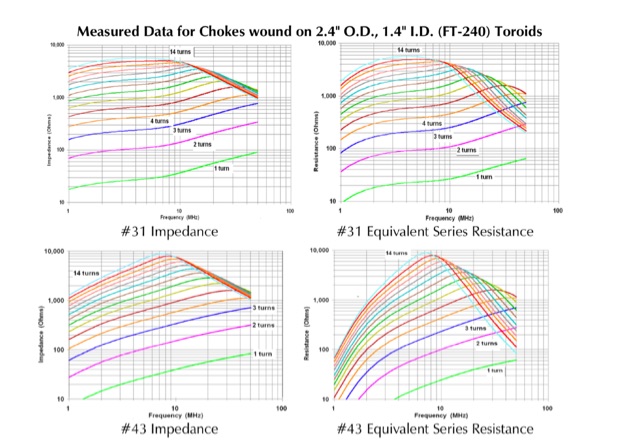 FT-240 toroids measurements. The data was measured using well-calibrated HP instrumentation. All plots have been adjusted to a frequency range of 1-100 MHz on the horizontal axis and a resistance/impedance range of 10-1,000 ohms on the vertical axis. This adjustment facilitates comparison among different materials and aids in determining their suitability for use on the HF ham bands.
 -
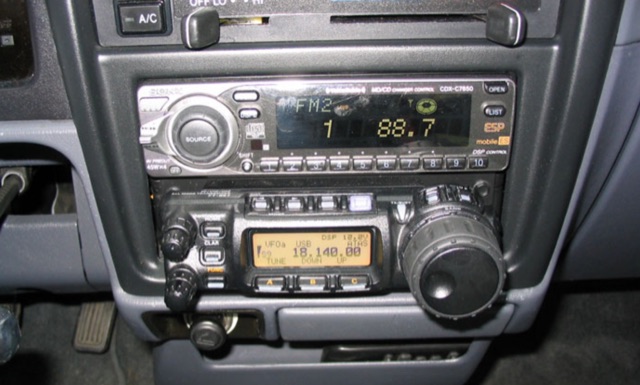 Detailing a Yaesu FT-857 and ATAS-120 installation in a 1997 Toyota Tacoma, the author used Polar Plot to map signal strength. Using a hand truck with a laptop, FT-817, and an Iron Horse antenna, they circled a chalk-outlined 100-foot diameter, revealing potential nulls towards the truck's rear and through the cab, offering insights into antenna performance.
 -
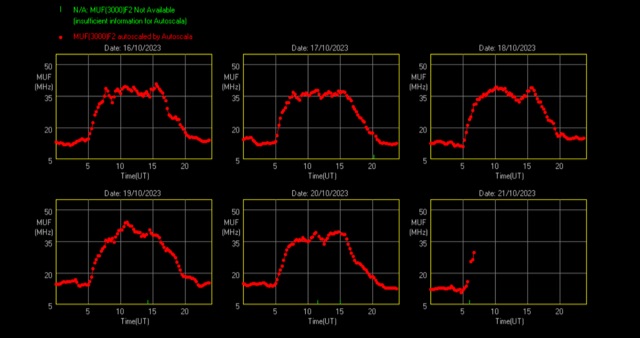 This page reports the last six daily MUF(3000)F2 plots recorded at Rome observatory by the AIS-INGV ionosonde. Provided Istituto Nazionale di Geofisica e Vulcanologia (INGV) Italy.
 -
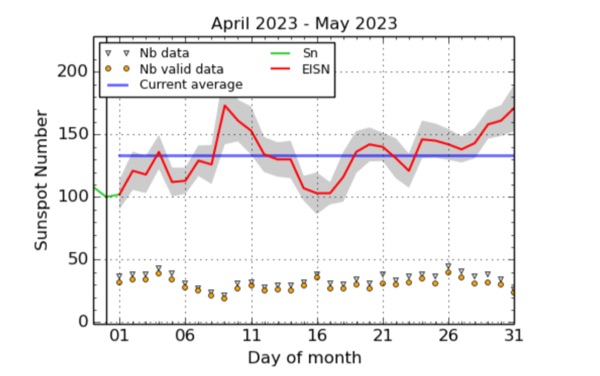 The estimated international sunspot number (EISN) is a daily value obtained by a simple average over available sunspot counts from prompt stations in the SILSO network.