Search results
Query: calculate receiver
Links: 6 | Categories: 0
-
 Demonstrates the construction and measurement of a single-turn HF receiving loop antenna, built from common materials like electrical conduit and lamp cord. The resource details the physical dimensions, including a 4-meter circumference, and calculates the theoretical inductance at approximately _6.4 uH_. It outlines a method for determining resonant frequencies across the 4-17 MHz range using a _C Jig_ and a _VR-500 receiver_, coupling the loop with a ferrite ring. The article also discusses the impact of receiver coupling on the loop's Q factor, noting a degradation in sharpness due to the transformer's reflected impedance. Analyzes the observed resonant frequency patterns, highlighting an unexpected rise in the loop's effective inductance at higher frequencies, particularly above 13 MHz. While some increase is attributed to distributed capacitance, the rate of rise suggests further investigation. The experimental setup provides practical insights into the challenges of maintaining high Q in simple receiving loops and offers a comparative reference for other homebrew antenna projects, such as those by _VK2TPM_.
 -
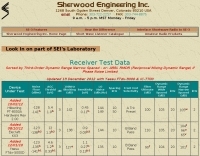 The Receiver Test Data resource is a detailed review database focusing on the performance metrics of various radio receivers. The methodology involves rigorous lab measurements, often adhering to standards such as the ARRL RMDR (Reciprocal Mixing Dynamic Range) and BDR (Blocking Dynamic Range). Specific test equipment and protocols are utilized to assess parameters like noise floor (dBm), AGC threshold (uV), and LO noise (dBc/Hz). For example, the _Icom IC-7300_ is evaluated with a noise floor of **-133 dBm** and an LO noise of **-141 dBc/Hz**, providing insights into its performance under different operational conditions. The resource includes a wide range of models, from the _Elecraft K3S_ to the _Yaesu FTdx-101D_, each tested for dynamic range, sensitivity, and selectivity. The data is sorted by key metrics such as third-order dynamic range and phase noise limitations, with RMDR values calculated by subtracting 27 dB from LO noise figures. This structured approach allows users to compare different receivers' capabilities, focusing on technical specifications and performance outcomes in various scenarios. DXZone Focus: Review Database | Lab Measurements | -133 dBm | ARRL RMDR
 -
 Friis-It NF is the first iPhone OS based application that allows you to calculate noise figure, system sensitivity, and cascaded gain for an RF Receiver system
 -
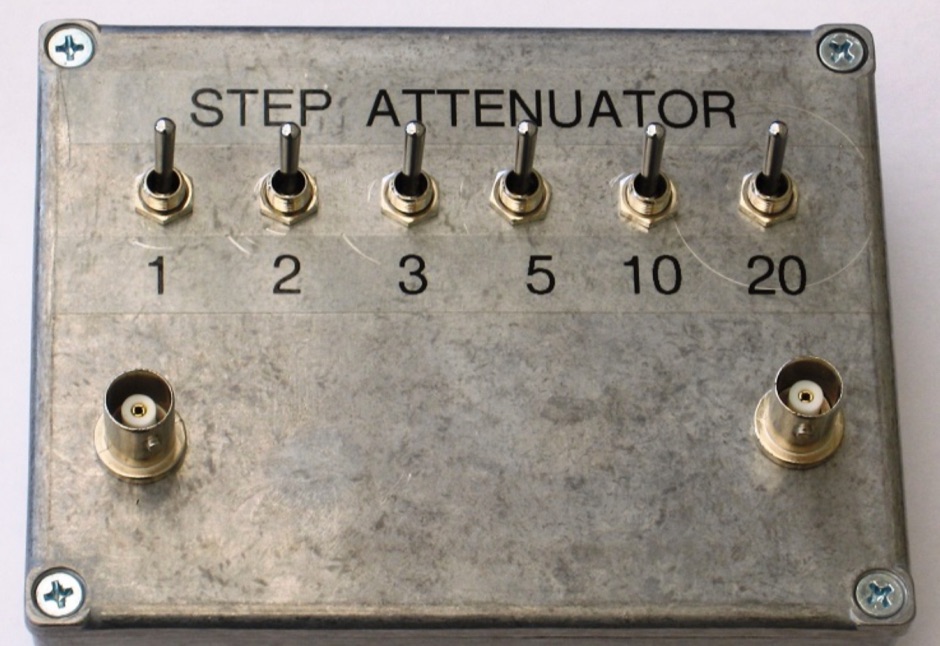 A 0-30 MHz step attenuator, constructed from switchable Pi attenuation pads, provides a practical tool for evaluating receiver sensitivity and calibrating S-meters. The design utilizes readily available 5% tolerance resistors, with values derived from paralleled components to achieve specific attenuation steps. A schematic (Fig 1) illustrates the circuit, including PCB pad shielding, while a table details required and actual resistor values, along with percentage differences. Measurements of voltage input versus output at various frequencies are used to calculate dB attenuation, presented in a graph (Fig 4). The resource includes formulas for determining output voltage from a known input and a comprehensive 0-40 dB voltage multiplier table, which is crucial for precise signal level management. The project also references external attenuator calculators and equations for further study. Photos (1-3) provide visual guidance for the assembled unit, showing bottom, top, and front views. The project emphasizes the use of **Pi attenuation pads** and **receiver sensitivity** evaluation, offering a hands-on approach to RF signal management.
 -
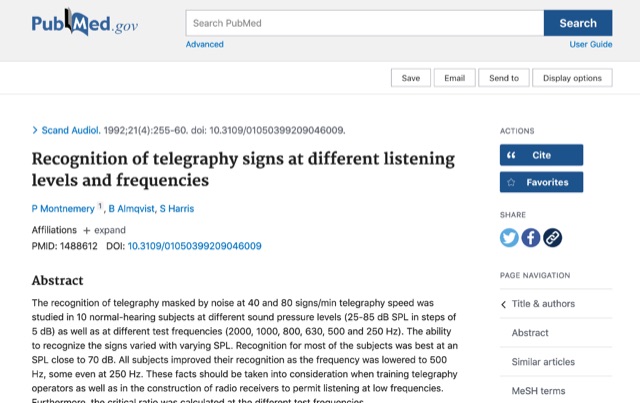 The recognition of telegraphy masked by noise at 40 and 80 signs/min telegraphy speed was studied in 10 normal-hearing subjects at different sound pressure levels (25-85 dB SPL in steps of 5 dB) as well as at different test frequencies (2000, 1000, 800, 630, 500 and 250 Hz). The ability to recognize the signs varied with varying SPL. Recognition for most of the subjects was best at an SPL close to 70 dB. All subjects improved their recognition as the frequency was lowered to 500 Hz, some even at 250 Hz. These facts should be taken into consideration when training telegraphy operators as well as in the construction of radio receivers to permit listening at low frequencies. Furthermore, the critical ratio was calculated at the different test frequencies.
 -
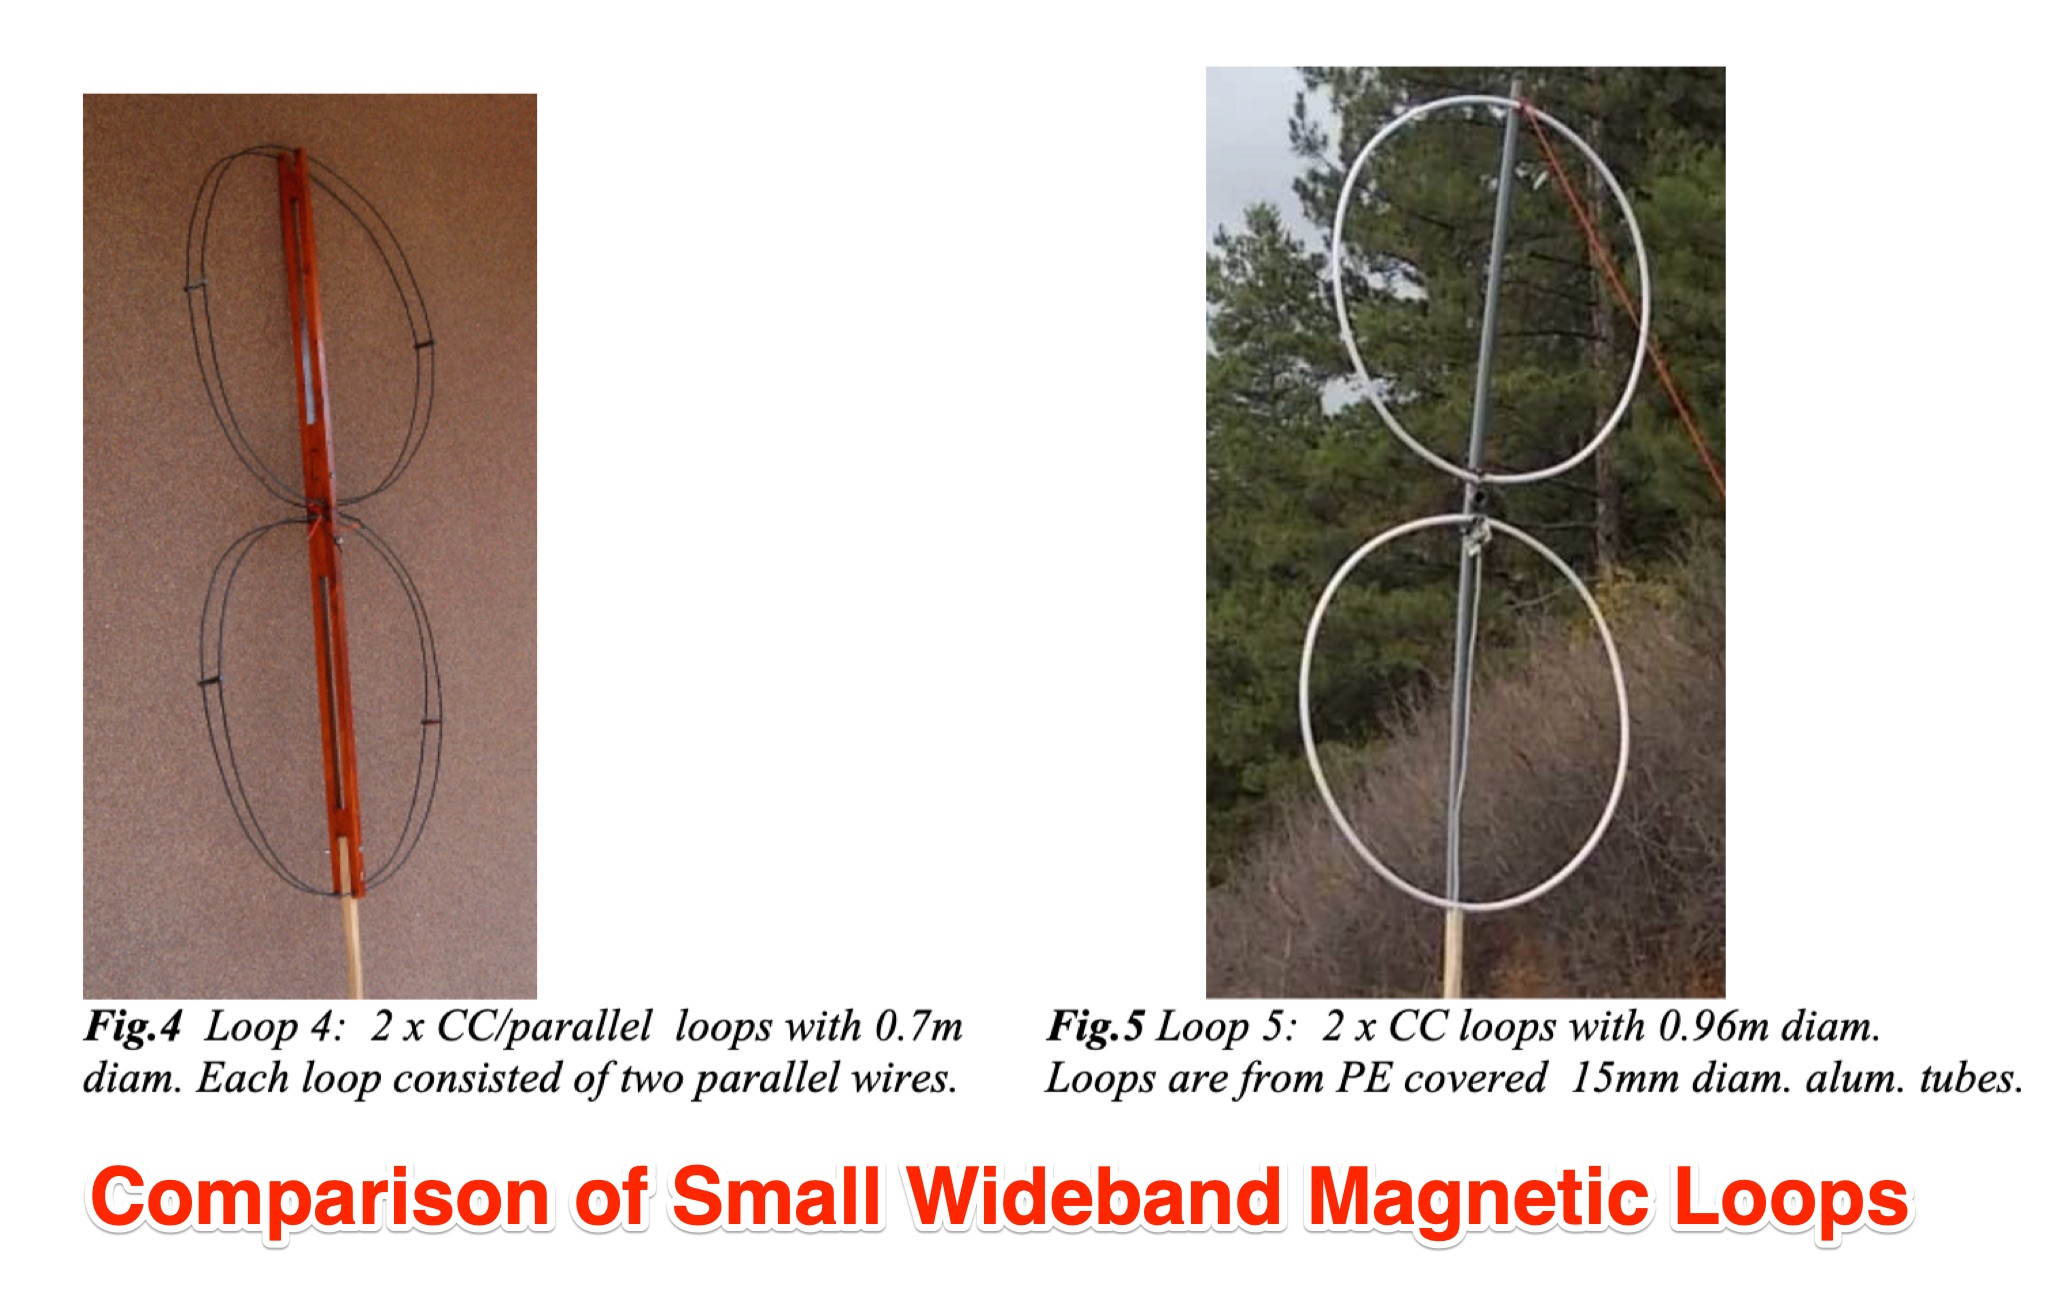 Chavdar Levkov, LZ1AQ, presents an experimental comparison of small wideband magnetic loops, building on his previous work on wideband active small magnetic loop antennas. His research focuses on increasing loop sensitivity by maximizing the short-circuit current, which is directly tied to the "loop factor" M = A/L, where A is the equivalent loop area and L is its inductance. Levkov's methodology involves reducing inductance and increasing area through parallel or coplanar crossed (CC) configurations, comparing these designs against a reference single quad loop of 1 m2 area. Experimental verification included testing three distinct loop types: a simple quad loop, two coplanar crossed (CC) loops, and eight parallel loops, all designed to have a total geometric area of 1 m2. Measurements were conducted at 1.8, 3.5, 7, and 10 MHz using a small transmitter 270 meters away, with a Perseus direct sampling receiver for precise signal level assessment. The results consistently showed that CC loops, particularly Loop 5 (two CC circular loops with 1.44 m2 total area), yielded significantly higher currents, up to 9.1 dB over the reference loop at 3.5 MHz, validating M as a reliable predictor of loop sensitivity. Numerical simulations using MMANA further corroborated the experimental findings, demonstrating an almost perfect correlation between the calculated M factor and the induced loop current for 15 different loop models. Levkov concludes that CC loops offer superior sensitivity for a given loop area, while parallel loops are advantageous for minimizing physical volume. Practical recommendations suggest using loops with an M factor greater than 0.5 uA/pT for quiet rural environments, and he provides a spreadsheet tool, WLoop_calc.xls, to aid in optimizing loop configurations for specific operational needs.