Search results
Query: gladstone
Links: 3 | Categories: 0
-
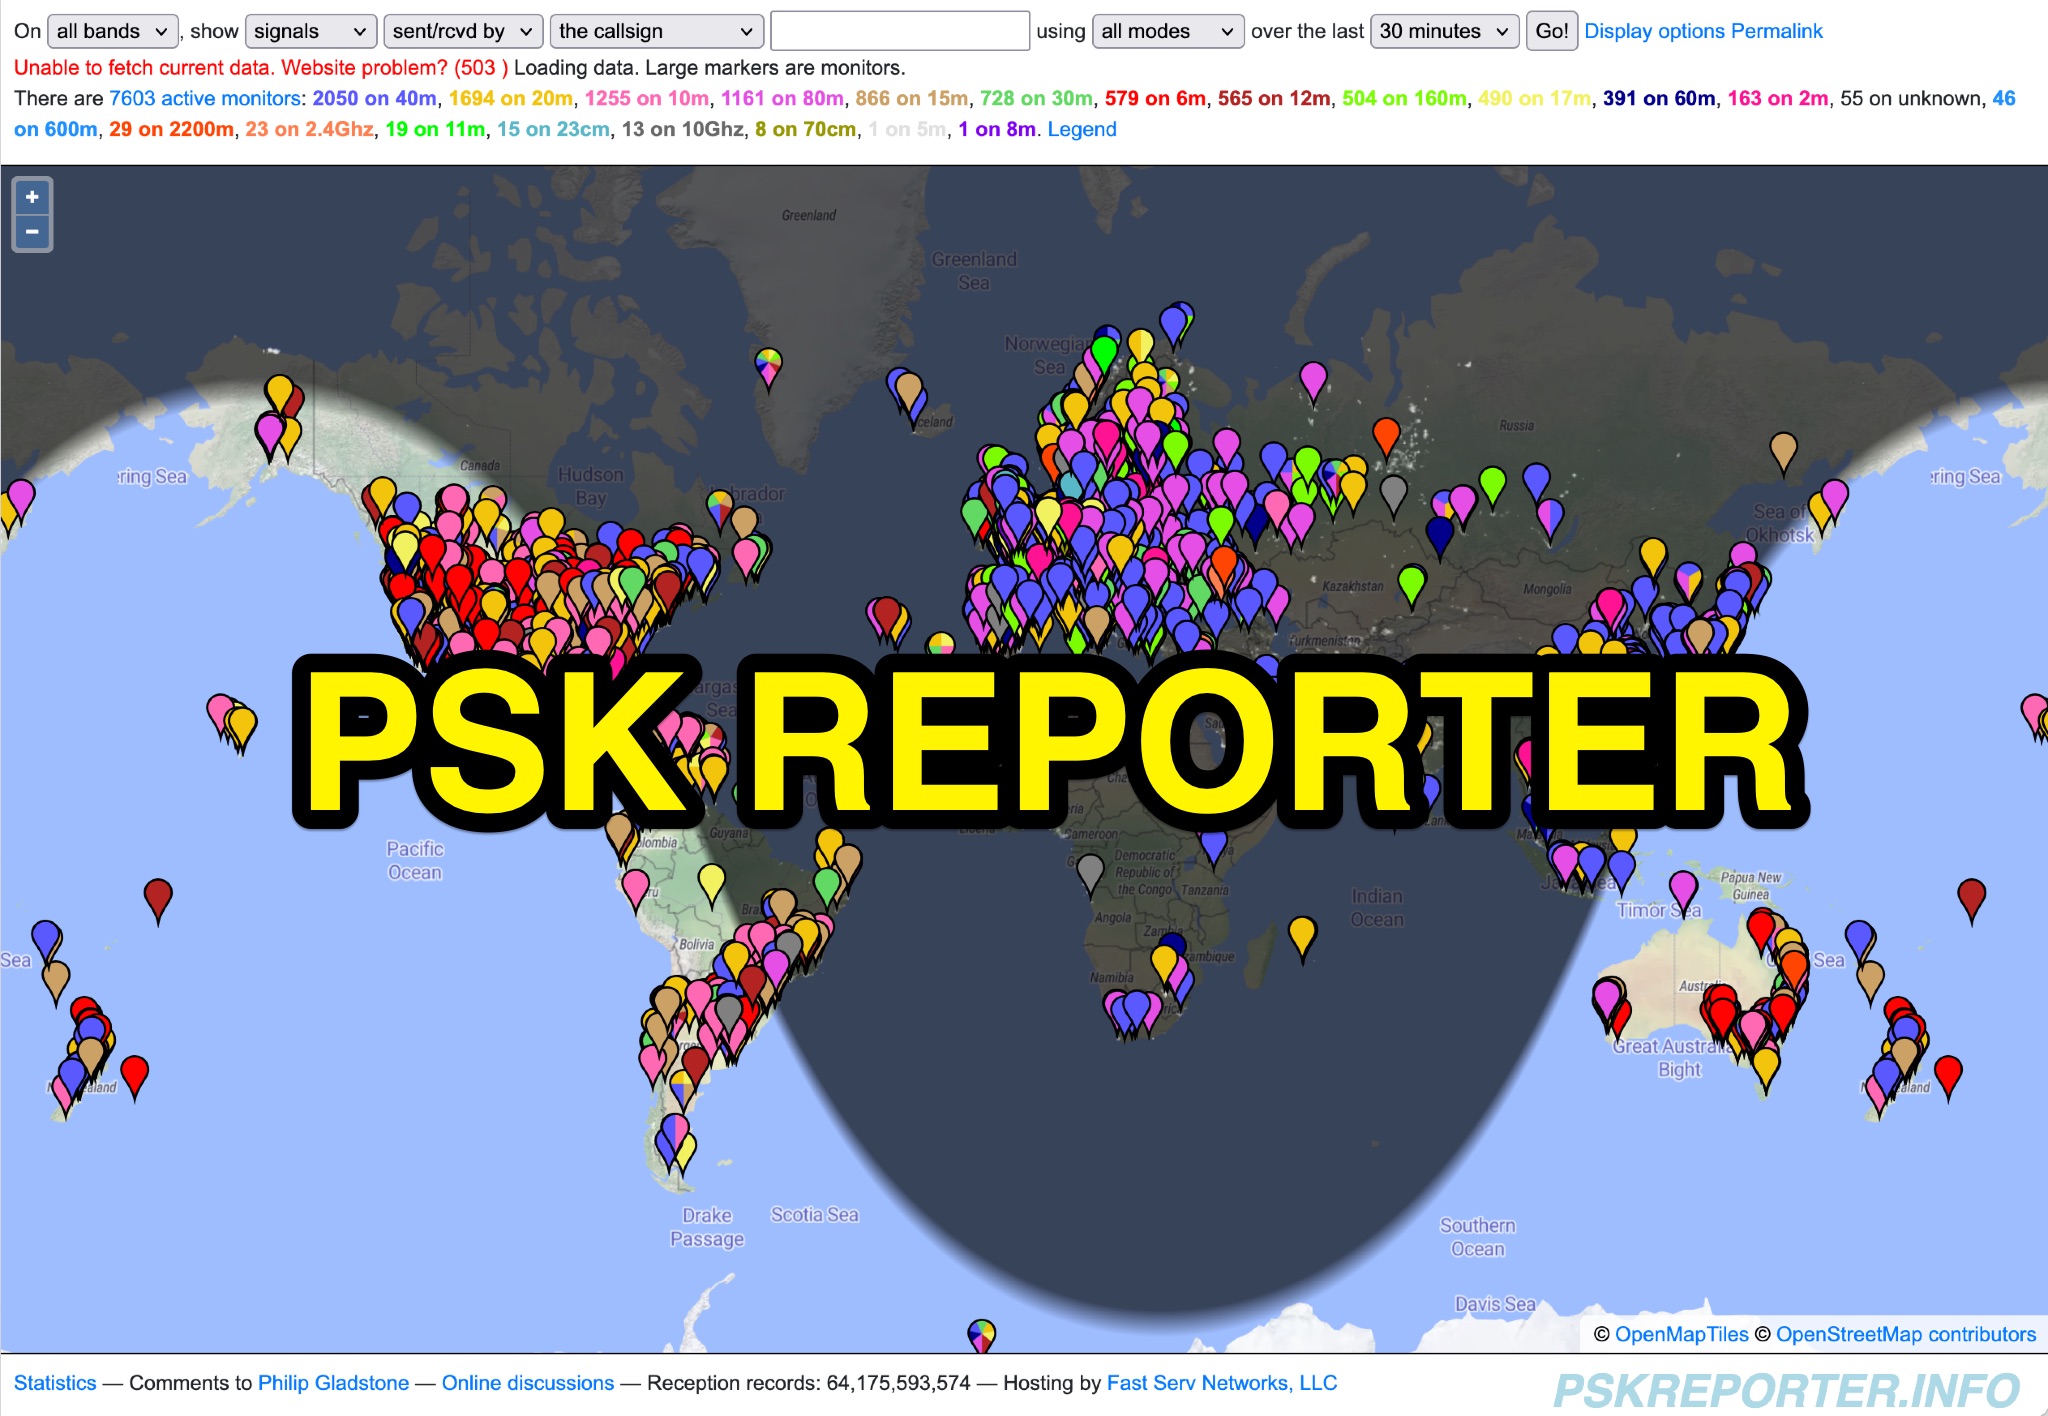 PSK Reporter provides a real-time visualization of amateur radio digital mode reception reports, aggregating data from a global network of monitoring stations. This platform is particularly useful for operators utilizing modes such as FT8, FT4, and PSK, allowing them to observe signal propagation paths and assess their station's reach. The interactive maps display reception reports, enabling hams to analyze band conditions and optimize antenna performance for various frequencies and times of day, aiding in understanding ionospheric conditions. Operators can filter reports by callsign, band, mode, and time, gaining insights into specific propagation events or evaluating the effectiveness of their transmit setup. The data collected helps in predicting optimal operating windows for DX contacts across various digital modes. Philip Gladstone is the contact person for comments and discussions regarding the system.
 -
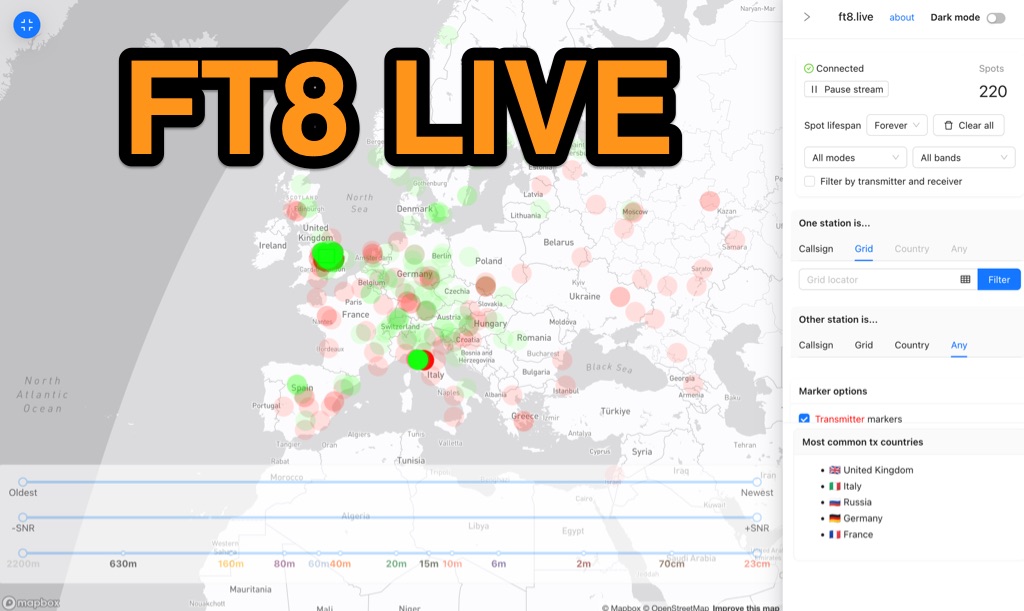 Visualizes real-time amateur radio propagation spots using data from the PSK Reporter MQTT stream, providing immediate situational awareness for radio operators. The platform displays spots from various modes, including CW, WSPR, and JT65, in addition to the dominant FT8 digital protocol. FT8 Live focuses exclusively on live data streams, prioritizing current signal activity over historical archiving, which differentiates it from the official PSK Reporter map. A key feature is its integration with the Summits on the Air (SOTA) API, facilitating SOTA chasing by cross-referencing transmitting callsigns with SOTA alerts; a station is identified as an activator if the spot correlates with a scheduled alert within an eight-hour window. The user interface was developed by Arron (ZL1AN), with core data from Philip Gladstone (N1DQ), and stream delivery managed by Tom Stanton (M0LTE).
 -
 Spotty leverages Philip Gladstone’s pskreporter.info data, delivered via an MQTT broker by Tom Fanning (M0LTE), to offer a responsive web application for visualizing propagation. The Map View presents a default visualization (grid AA00 / callsign MY8CALL) and distinguishes signal types: small spots for signals heard by a location, large spots for transmissions from a location, and teardrop markers for transmissions from the monitored callsign. Clicking a spot reveals detailed signal data in an overlay. The application includes a Log View for raw spot data and a Settings tab for customization. Users can filter tracking by specific Callsign or Grid, with preferences saved to the browser. A notable feature is the Time to Live (TTL) setting, adjustable from the default 60 seconds, which controls spot visibility duration to manage map clutter during high-traffic periods. The tool provides a clear, logic-driven interface for real-time signal monitoring.