Search results
Query: live dx maps
Links: 5 | Categories: 0
-
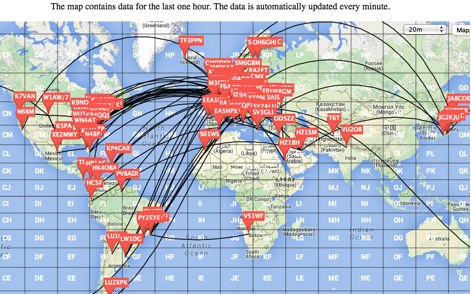 This is a Live DX Cluster map powered by google maps diplays a map of ham radio QSOs or contacts based on qra locator and dx-cluster spots information
 -
 Over 47 full-screen maps are available within _NAOMI_ (North American Overlay Mapper), a free Windows program designed for US and Canadian amateur radio enthusiasts. This mapping suite includes 9 backgrounds such as CQ Zones, ITU Zones, and ARRL Sections, along with 16 foreground layers like Counties, Areacodes, and Grid Locators. Users can calculate distances and bearings, track real-time mouse positions with continuous Grid-Locator data, and integrate with APRS for live station tracking via the FindU database. For a global perspective, the _Global Overlay Mapper_ (GOM) provides a world map, 8 continental maps, and 29 sub-continental maps, all with 12 active layers including Country Outlines, CQ/ITU Zones, and Prefix information. Both NAOMI and GOM offer feature-locate systems to jump to positions based on prefixes, capital cities, or Grid Locators, and provide customized beam headings and distance displays. The site also features _LogView_, a post-contest log visualization tool that analyzes Cabrillo-format logs by plotting QSOs on maps, supporting over 30 major contests like CQWW and ARRL DX, and allowing comparison with published results.
 -
 A comprehensive resource center with DX aids, live propagation, callsign searches, news and bulletins, maps, and more by NW7US
 -
 Live DX spots are presented through a _web cluster_ interface, utilizing both a world map and a Google Maps display for visualizing amateur radio propagation. The system provides real-time spotting data, enabling operators to track active stations globally. Users can observe current band conditions and station activity, which is crucial for optimizing contact strategies across various amateur bands. The platform's utility extends to contest operations and general DXing, offering a visual representation of where stations are being heard. While the primary function is DX spotting, the site also includes technical articles, such as instructions for interlocking two Flex Radios for single-transmitter compliance in contests, and a guide for constructing a simple **5KW** 1:1 balun for **160m/80m** dipoles using RG400 cable. This combination of live data and practical technical content supports both operational awareness and station improvement.
 -
 The Reverse Beacon Network (RBN) graph presents a dynamic visualization of amateur radio spots, specifically tracking CW, BPSK, and RTTY signals over the last 15 minutes. Users can filter these real-time spots by DX continent, spotter continent, and individual frequency bands, including **160m through 70cm**. The interface also offers a bandwidth reduction option, which is particularly useful for operators with limited internet connectivity. This resource provides a unique perspective on propagation conditions and station performance by aggregating data from various _Reverse Beacon Network_ nodes. It automatically refreshes every 10 seconds, ensuring that the displayed information is current and relevant for active DXers and contesters. The graph's Y-axis represents time, with each spot indicating activity within a one-minute interval. Beyond the primary RBN graph, the platform also features dedicated maps for both DXCluster and RBN data, including azimuthal projections. An additional FT8 graph is available, though noted as being under construction, indicating ongoing development to expand its utility for digital mode enthusiasts. The system was developed by HA8TKS, with the initial concept attributed to CT1BOH.