Search results
Query: path analysis
Links: 6 | Categories: 0
-
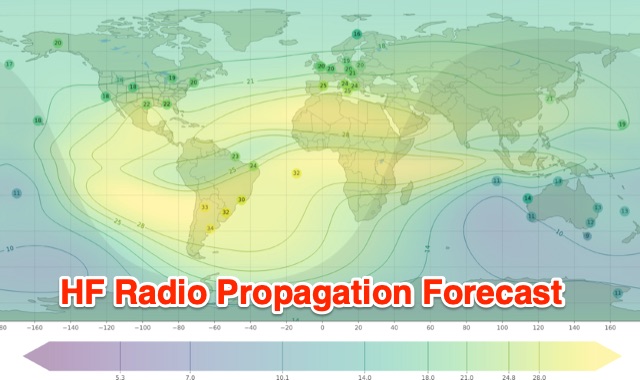 Understanding high-frequency (HF) skywave propagation is crucial for amateur radio operators seeking to optimize long-distance communications. This resource details the fundamental principles of HF radio propagation, including the properties of electromagnetic waves, the characteristics of various HF bands, and distinct propagation modes such as skywave, ground wave, and line-of-sight. It places significant emphasis on the ionosphere's pivotal role in refracting HF waves, explaining how solar activity directly influences ionospheric conditions and, consequently, propagation paths. The resource integrates real-time monitoring capabilities, featuring dynamic charts and data from DX clusters, WSPRnet, and the Reverse Beacon Network, which allow users to track current band activity and propagation conditions globally. It also delves into advanced topics like Near Vertical Incidence Skywave (NVIS) and gray line propagation, providing insights into ionosonde data and various propagation prediction models. The site presents a detailed analysis of solar-terrestrial interactions, geomagnetic indices, and space weather phenomena, illustrating their direct impact on HF communication reliability. Practical tools and applications are highlighted, including real-time QSO planners, online Maximum Usable Frequency (MUF) maps, and alerts for solar flares or geomagnetic storms. The guide systematically breaks down complex concepts into accessible chapters, offering a structured approach to learning about ionospheric regions, diurnal and seasonal effects, and the interpretation of propagation indicators like foF2, MUF, and Lowest Usable Frequency (LUF). This makes it a robust reference for hams aiming to deepen their technical understanding and improve operational effectiveness.
 -
 A 2x3-foot laminated world map product is detailed, offering customization for amateur radio operators. Each map features two distinct views: one centered on the operator's specific station location and another precisely centered on its _antipode_. Countries are clearly labeled, complemented by a tabular listing of all countries. The map integrates a standard latitude/longitude grid alongside concentric circles that delineate distance increments radiating outward from the operator's QTH. Personalization includes the operator's name, callsign, and location printed directly on the map. This custom mapping service provides a unique visual aid for DXing and propagation analysis, allowing operators to quickly ascertain beam headings and distances from their station. The dual-view presentation, particularly the antipodal centering, offers a practical reference for understanding long-path propagation and identifying potential DX opportunities. The inclusion of distance circles and personalized station data makes it a tailored tool for daily operating and contest planning, distinct from generic world maps.
 -
 BeaconSpot.uk provides an accurate, real-time picture of microwave and VHF/UHF beacons operating across Europe, alongside a worldwide listing of 6-meter beacons. The platform allows users to retrieve detailed data for individual beacons, facilitating in-depth analysis of signal characteristics and propagation paths. Interactive maps visualize beacon distribution by frequency band and display spot coverage for each station, offering a clear geographical overview of active beacons. The system integrates real-time DXCluster spots, sourced from contributors like Alain, ON4KST, and Pascal, F5LEN, and enables users to submit outgoing spots directly to the DXCluster. Beacon keepers can manage their beacon data, receive email alerts upon being spotted, and track their station's ODX (Outstanding DX) records. For every received spot, the distance to the beacon is automatically calculated and displayed, aiding propagation studies.
 -
 Sw tool to design point-to-point multi-hop microwave links and networks, 400MHz to 58 GHz. Site/Hop Configuration; Customized Antenna & Radio Equipment Libraries; Link Budget; Path Profile Analysis ,clearance, reflections; import path profiles from SRTM maps, free download.
 -
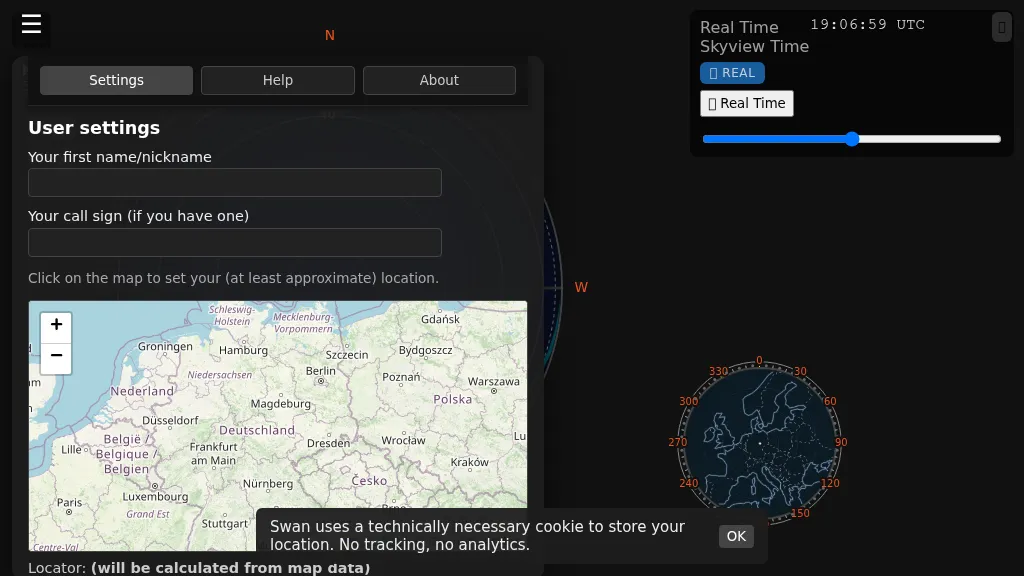 Swan provides a real-time, browser-based visualization of **meteor radiants** and forward scatter corridors, serving as a modern re-imagining of the classic Virgo meteor sky visualization tool. It displays meteor radiant and radio scatter geometry, offering both visual and numerical skyview data. The tool updates in real-time, showing current sky conditions and allowing users to pause and review specific timeframes for analysis of meteor shower activity and potential radio propagation paths. This enables operators to identify optimal windows for **meteor scatter** contacts. Operators can utilize Swan to predict and optimize their meteor scatter DX attempts by understanding the geometry between their station, meteor radiants, and potential receive stations. The interface presents critical data points for assessing forward scatter opportunities, which is crucial for maximizing short-duration meteor burst communications. By observing the real-time skyview, users can correlate meteor activity with observed signal enhancements, refining their operating strategies for specific meteor showers or random meteor pings.
 -
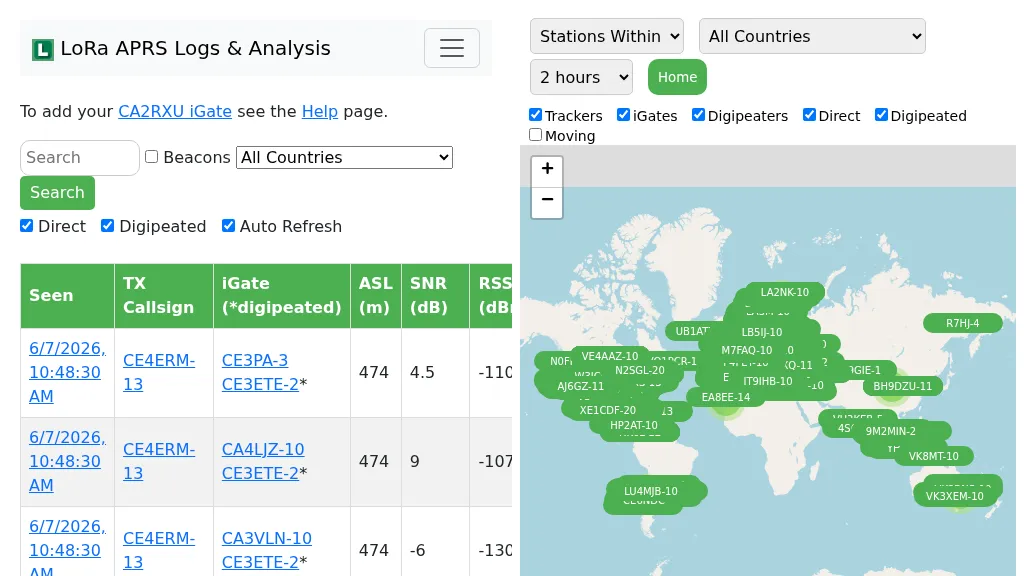 Demonstrates the operational status and reach of the LoRa APRS infrastructure, providing a live mapping and logging service for network participants. Users can verify network coverage, monitor _iGates_, and track mobile stations, observing messages and real-time network activity. The platform offers insights into station locations and data flow within the LoRa APRS system, which is crucial for understanding the performance of LoRa technology in Automatic Packet Reporting System applications. This utility helps amateur radio operators understand where transmissions are being received and processed by iGates, and how mobile units are moving within the network. The site's analysis tools provide RF performance monitoring and metrics, enabling users to assess network efficiency and identify areas for improvement. For example, operators can see how many packets are received by specific iGates, or track the path of a mobile station over a **100 km** range, offering practical insights into signal propagation and network reliability for _packet radio_ enthusiasts.