Search results
Query: plot
Links: 68 | Categories: 0
-
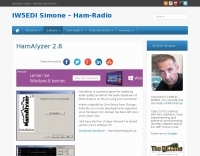 HamAlyzer is a spectrum analyzer made just for hams, save plot images easily for emailing, monogramed with your call sign. HamAlyzer looks no more supported, here 2.8 trial version available. Download hamalyzer
 -
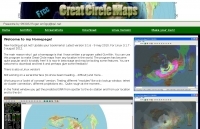 GCM is a freeware great circle map plotting software for windows, you can choose colours, scale, meridians, fields and or squares from the maidenhead locator system.
 -
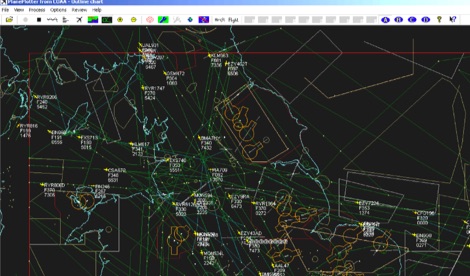 PlanePlotter is a windows decoder of live digital position reports from aircraft and plots them on a chart. Using PlanePlotter, you can see a radar-like display of all those aircraft around you that are transmitting the appropriate digital messages including ACARS, ADS-B and HFDL. Full Trial available for 21 days.
 -
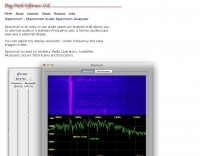 Macintosh audio spectrum analyzer that allows the user to view live audio in a standard frequency plot, a stereo oscilloscope view and a waterfall display
 -
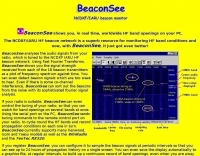 BeaconSee shows you, in real time, worldwide HF band openings on your PC. Analyses the audio signals from your radio, which is tuned to the NCDXF IARU HF beacon network and shows you the signal strength received from each of the 18 beacon transmitters as a plot of frequency spectrum against time.
 -
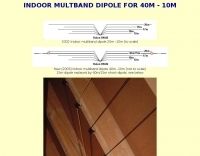 Indoor multiband dipole with EZNEC data files for simulation and analysis. Includes details on construction, tuning, SWR plots, and software usage. This page includes two different dipoles, a first version for 20-10 meters and an extended version covering 40-10 meters allowing a full coverage of most used ham radio HF Bands.
 -
 The AZIMUTH program plots a world map in either azimuth (beam heading) or Mercator projections. If you specify your home location in latitude and longitude, the azimuth projection is centred on your location. The Azimuth map program can display Maidenhead grids - this is useful for 6m, 2m, and UHF DX communication display. Various features of the map are: Azimuth or Mercator projections , Maidenhead grid display, Simple map zooming, Print maps with adequate resolution up to one meter sized map
 -
-
 Freeware antenna software that lets you see what the polar diagram of your rotatable beam actually looks like where it is operating. With PolarPlot you can measure the polar diagram of the antenna and check for abnormalities - compare plots taken before and after changes to the design or location - check the -3dB beamwidth - look at the front to back ratio - see the size and position of the sidelobes.
 -
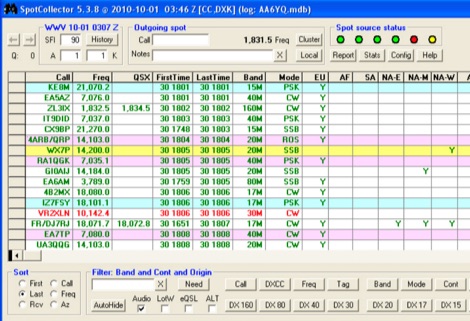 A free application that captures DX and WWV spots from up to 5 internet clusters and a local packet cluster. DX Spots are merged and stored in a Spot Database on your PC, enabling you to monitor, sort, and filter them in real time; known LotW participants are highlighted, as are needed stations. WWV spots are plotted to show SFI, A, and K over the last solar revolution.
 -
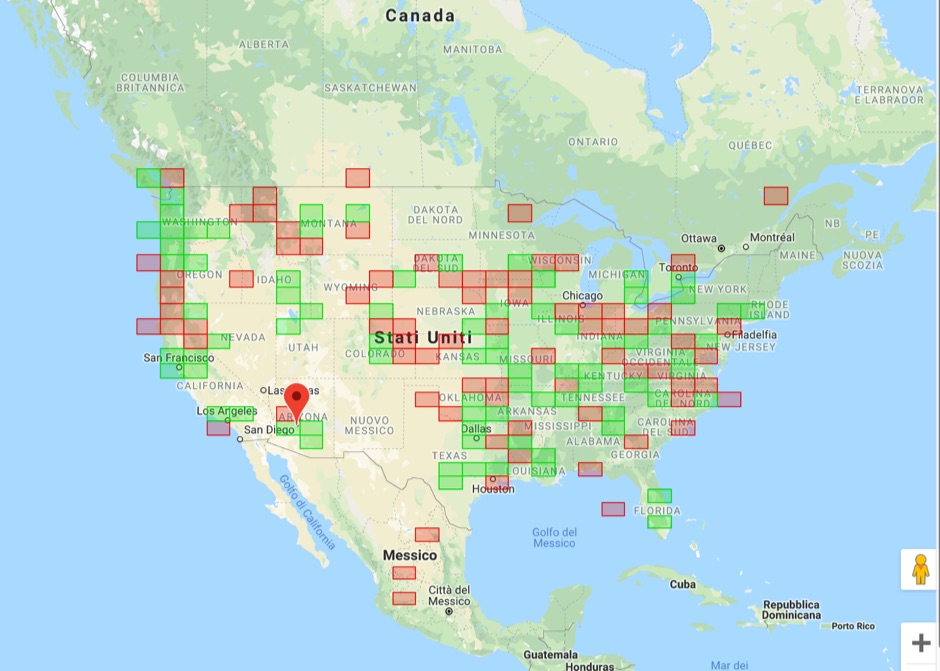
 DXMaps.com presents a dynamic, real-time mapping service for amateur radio DX spots, integrating data from traditional DX clusters, _PSK Reporter_, and WSPR networks. The platform visually plots global QSO and SWL activity, enabling users to observe propagation conditions across various bands, from 2200m to >450 MHz. It offers distinct overlays such as the magnetic equator, gray line, moon footprint for EME, and VOACAP propagation predictions, providing a comprehensive view of radio wave behavior. The service allows granular filtering of displayed spots, including options to show only DX-Cluster data, PSK Reporter activity, or WSPR signals. Users can refine the map view by selecting specific bands (e.g., 160m, 20m, 6m, 2m), limiting spots to the last 15 minutes, or displaying only contacts exceeding **2600 km**. Additional features include the ability to toggle grid squares, aurora forecasts, and various amateur radio zones (CQ, ITU). Distinctively, the resource updates automatically every minute, ensuring current propagation intelligence without manual refresh. It also supports specialized views for EME, ionospheric scatter, and aircraft scatter, alongside FM DX and APRS activity. The platform emphasizes the importance of accurate locator information in DX spots to enhance data quality and offers a user manual and FAQ for guidance.
 -
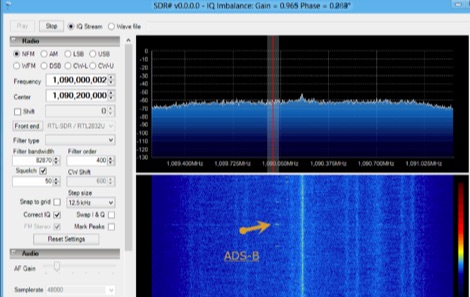 Free Windows ADS-B decoder for RTL-SDR dongles included in SDR#. It allow to broadcast data locally or to radar software sever such as Planeplotter, Virtual Radar Server, adsbSCOPE.
 -
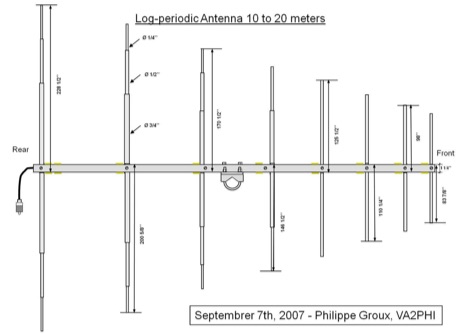 10 to 20 meters band log-periodic antenna project with SWR Plots, boom lenght and element spacing.
 -
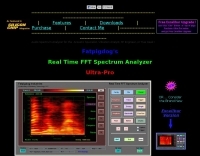 Fatpigdog's Real Time FFT Audio Spectrum Analyzer. User interface has the look and Feel of an HP Spectrum Analyzer. But, in addition to the regular Spectrum Plot, it also produces detailed Waterfall plots. The user can optimize the color map, chosing from a wide assortment of color themes. This analyzer supports multiple traces, trace arithmetic and normalization.
 -
 Download a 6 meter moxon antenna, drawings, photos, plots by Allen Baker KG4JJH, (10 Mb!)
 -
 Operating amateur radio satellites effectively requires precise knowledge of their orbital mechanics and pass times. Gpredict, a real-time satellite tracking and orbit prediction application, addresses this need by allowing operators to monitor numerous satellites simultaneously. It displays critical data such as position and pass details through various visualizations, including lists, tables, maps, and _polar plots_. Unlike many other satellite tracking programs, Gpredict introduces the concept of visualization modules. These modules enable users to group satellites and configure each group independently, offering unparalleled flexibility in how orbital data is presented. This modular approach supports tracking satellites from multiple observer locations concurrently, which is particularly useful for stations with diverse antenna setups or remote operations. Originally a GUI client for John Magliacane's _Predict_ program, Gpredict evolved to integrate its own tracking code for improved performance. The software is distributed under the GNU General Public License, ensuring it remains free and modifiable for the amateur radio community.
 -
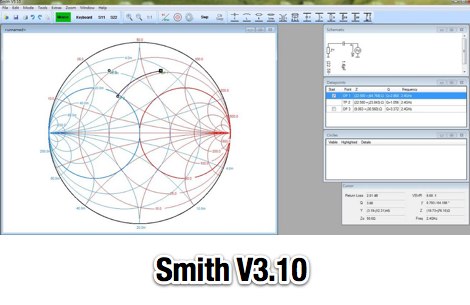 Smith is a professional Computer Smith-Chart Tool and S-Parameter Plot for windows, special price for hams and students by Fritz Dellsperger
 -
 Windipoles is a free passive real time filter simulator. Developed under Visual Studio .NET. No software installation required. Allows design, analysis, optimizations and plots, all graphically.
 -
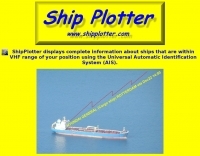 ShipPlotter displays complete information about ships that are within VHF range of your position using the Universal Automatic Identification System (AIS).
 -
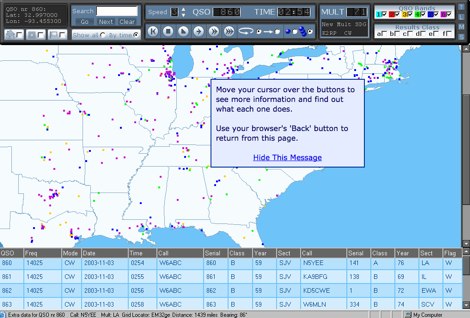 LogView is a free post-contest log-visualisation tool, for analysing contest performance. It plots the QSOs in a Cabrillo-format contest-log on to one of 8 different maps by finding the position of each QSO from an online database of about 970,000 W/VE callsigns.
 -
 A home made vertical polarized moxon antenna for 144 MHz, includes dimensions, antenna pattern, SWR and antenna gain plots by WB5CXC
 -
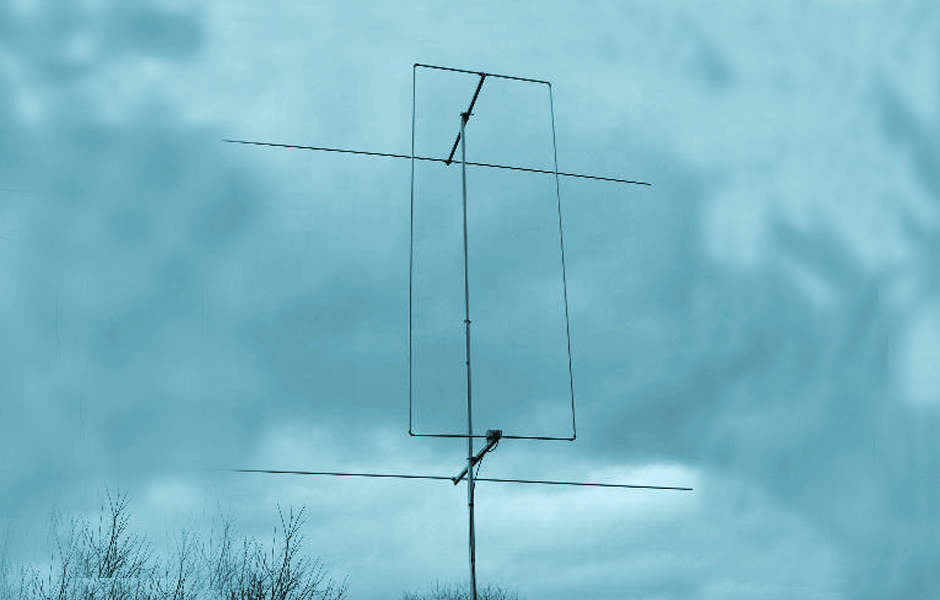
 Demonstrates the design and construction of a 9-element Yagi antenna for the **70 cm band** (432 MHz), based on the DK7ZB concept. The resource details EZNEC+ calculations for a single antenna, providing gain, sidelobe suppression, and front-to-back ratio figures. It also presents a comprehensive analysis of stacking two such antennas, including optimal stacking distance (1000 mm) and the resulting performance enhancements for the stacked array, such as an increased gain of 17.03 dBi. The article includes detailed drawings, wire file dimensions in millimeters, and azimuth/elevation plots for both single and stacked configurations. Practical construction steps are documented with original photographs, illustrating element mounting, the **28 Ohm matching system** using two quarter-wave 75 Ohm transmission lines, and the critical N-connector wiring. It also covers the iterative process of fine-tuning the driven element length to achieve a return loss of 20 dB, validating the EZNEC+ simulation results with actual measurements.
 -
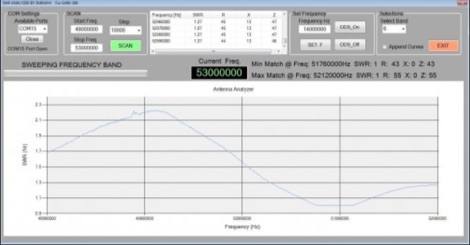 A windows program that scans the SARK-100 and plot the SWR Vs frequency. The data can also be stored as an Excel file. The min and max match frequency is calculated. Donationware
 -
 Powerful antenna modeling tool using NEC 2 computing engine. Nec2 specifically provide users, either those experienced with the Nec2 processes, or for those who are neophytes but want to model their own antennas. Nec2Go uses a simplified process for defining the antenna structure and then providing view of the structure, plots (2D and 3D) and other significant data that is pertinent to the design. This simplified process uses an edit file with equations for all definitions.
 -
 Presents a construction project for a linear-loaded 40-meter rotatable dipole, detailing the design evolution from mid-element coils to 300-ohm twinlead loading. It covers material selection, including repurposed fishing poles and EMT conduit, and outlines the assembly process for the antenna elements and mounting plate. The resource provides specific measurements for element lengths and linear loading sections, along with SWR plots demonstrating the antenna's resonance at 7.035 MHz with a 1.1:1 SWR, and bandwidth up to 7.120 MHz below 2:1 SWR. The article documents the antenna's performance during various RTTY and CW contests, including the SARTG RTTY and SCC RTTY contests in August 2006, and the ARRL DX CW and CQWW WPX RTTY contests in February 2007. It reports successful operation at 500-1000W, noting improved performance after replacing a faulty coax cable. Specific DX contacts from British Columbia, including stations in Europe and South Africa, are listed, illustrating the antenna's capability despite its shortened length and relatively low height of 55 feet. The content highlights practical considerations such as weatherproofing the connections and supporting the fiberglass elements to prevent sagging. It also includes a brief comparison to an inverted-V at similar height and a ground-mounted vertical, noting the rotatable dipole's quieter reception. The author shares insights into the iterative design process and tuning adjustments made to achieve optimal resonance.
 -
 VOAProp shows you typical propagation for a given hour of the day during a given month. The propagation is shown as expected signal strengths to be received from different parts of the world, plotted on a world map. Windows freeware by G4ILO
 -
 Over 47 full-screen maps are available within _NAOMI_ (North American Overlay Mapper), a free Windows program designed for US and Canadian amateur radio enthusiasts. This mapping suite includes 9 backgrounds such as CQ Zones, ITU Zones, and ARRL Sections, along with 16 foreground layers like Counties, Areacodes, and Grid Locators. Users can calculate distances and bearings, track real-time mouse positions with continuous Grid-Locator data, and integrate with APRS for live station tracking via the FindU database. For a global perspective, the _Global Overlay Mapper_ (GOM) provides a world map, 8 continental maps, and 29 sub-continental maps, all with 12 active layers including Country Outlines, CQ/ITU Zones, and Prefix information. Both NAOMI and GOM offer feature-locate systems to jump to positions based on prefixes, capital cities, or Grid Locators, and provide customized beam headings and distance displays. The site also features _LogView_, a post-contest log visualization tool that analyzes Cabrillo-format logs by plotting QSOs on maps, supporting over 30 major contests like CQWW and ARRL DX, and allowing comparison with published results.
 -
 Homebrew a compact yagi antenna for 14 Mhz suitable for those with small plots based on a design by AB4GX
 -
 The Quadlong antenna for the six meter band. This antenna feature a total gain of 6,4 dBd, F/B 21 dB and is also available in 70MHz version. Includes detailed pictures and plot diagrams.
 -
 FreqTweak is a tool for FFT-based realtime audio spectral manipulation and display for Linux, offering various algorithms for audio processing in the frequency domain and an interactive GUI. It provides high-resolution spectral displays like scrolling-raster spectrograms and energy vs frequency plots.
 -
 Demonstrates the adaptation and construction of a 7-element DK7ZB Yagi antenna for the 4-meter band (70 MHz), utilizing components from a defunct 2-meter CUE DEE Yagi. The resource details the modifications made to the original DK7ZB design to fit the shorter CUE DEE boom length, specifically adjusting element lengths for 6mm rod elements while reusing existing mounting holes for the reflector and last director. It provides precise element lengths for the reflector, dipole (12mm aluminum tube), and five directors, along with a note on cutting elements for transport. The article includes a 4NEC2 simulation file for performance analysis and an SWR plot, confirming the antenna's electrical characteristics. It also specifies the calculation for the quarter-wavelength matching cable using SAT752F coaxial cable, resulting in a 909mm length. Practical application is shown with the finished antenna in operation at JO20XC, listing several activated Maidenhead squares such as JO56PA and JP40KS, validating its effectiveness for portable 70 MHz operations.
 -
 Draw static response time of an audio system. Originally intended for loudspeakers tests, is also a great tool for looking at microphone equalisation.
 -
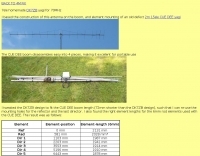
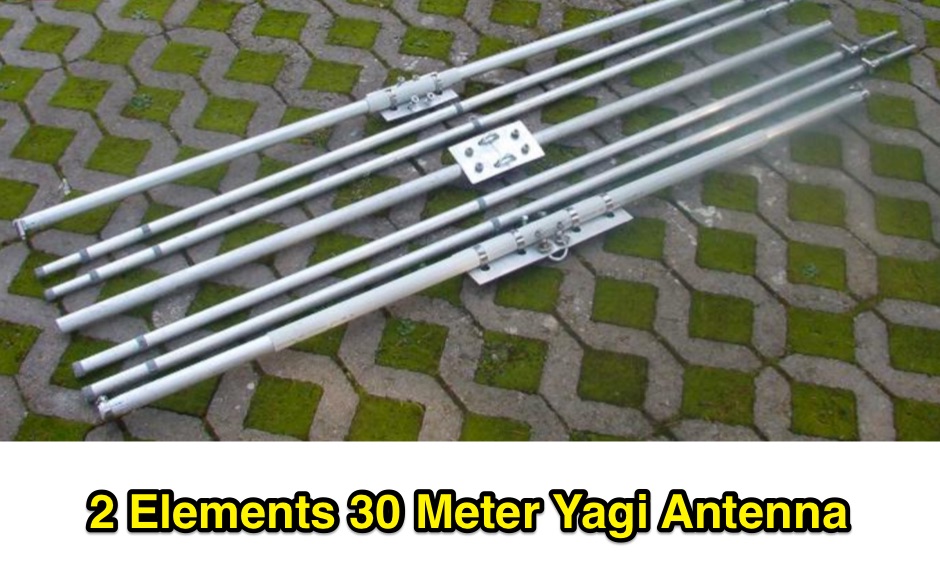 Dimensions and EZNEC plots for a 2 Element 30 meter Yagi antenna with 28 Ohm featuring 4.3 dBd Gain and a 16dB F/B with a good bandwidth.
 -
 Amateur radio direction finding, transmitter hunting web site from San Francisco. Triangulating a radio signal direction and plotting its bearing on a map. Hunters use doppler systems for tracking hidden transmitters anywhere in the san francisco bay area, fremont california
 -
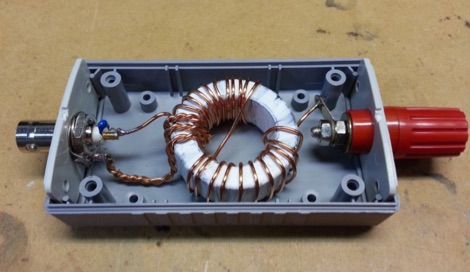 End-Fed Half Wave matching unit project, based on a FT140-43 with SWR plot tests made using capacitor and without.
 -
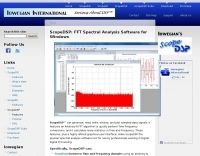 ScopeDSP analyzes sampled-data signals in the time and frequency domains. It can generate, read, write, window, and plot real and complex digital data signals.
 -
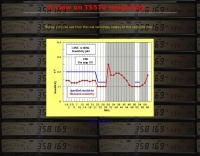 A view on TS570 sensitivity, a plot from 1.8 MHz to 60 MHz
 -
 pythonProp is a collection of Python scripts designed to plot files produced by VOACAP. The package currently contains two scripts, both of which make use of the matplotlib library
 -
 Xastir MacOSX APRS software for receiving and plotting APRS(tm) position packets. Xastir supports many map formats and is highly customizable
 -
 iSpectrum is a free spectrum analyzer for MacOS that allows you to display live audio in a standard frequency plot, waterfall display or in a stereo oscilloscope view. Used by ham radio operators, audiofiles, musicians, and Sound Technicians.
 -
 MS Excel document that allows you to plot SWR, resistance, reactance, impedance magnitude and angle and more from a variety of sources
 -
 Depiction mapping software can download and integrate maps, elevation plots, weather data, situation reports, damage assessments, volunteer movement, and more. It interface with your APRS ssystem
 -
 The SETI League, Inc., founded in 1994, focused on participatory science, developing technology to seek definitive answers to the question of extraterrestrial intelligence. The organization operated in five dozen countries across all seven continents, maintaining the quest for cosmic companions through the efforts of its 1500 members. Although the organization shuttered its virtual doors after thirty years in 2024, the website remains for educational and historical purposes, documenting past research and activities. Key technical resources include the _SETI League Mini-Manual_ for constructing a 12 GHz radio telescope under $200, and software like _SETIFox for Windows_ and _Radio Eyes_ for radio astronomy sky viewing. The site also features _Project Argus_ detections, moonbounce signal detections, and space probe signal detections, providing concrete examples of amateur radio astronomy applications. Publications such as the quarterly newsletter _SearchLites_ and various articles by Dr. SETI (H. Paul Shuch, Ph.D.) are available, alongside information on the Third Penn State SETI Symposium in 2025. The site also offers insights into hydrogen line emission observations, presented in time domain, frequency domain, waterfall, and surface plot formats.
 -
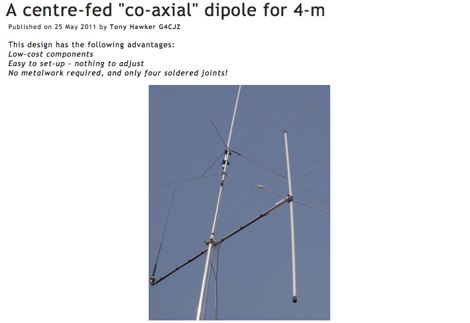 This web article details the construction of a 4-meter band coaxial dipole antenna, designed for operation between **70.000 MHz and 70.500 MHz**. The resource provides a bill of materials and step-by-step assembly instructions for a half-wave dipole constructed from _RG-58_ coaxial cable. The design specifies a direct 50 ohm feedpoint impedance, eliminating the need for an external matching network. Construction photographs illustrate the stripping and soldering processes for the coaxial cable elements, ensuring proper electrical connection and physical integrity. The article includes specific dimensions for the radiating elements, derived from calculations for the 70 MHz band. The project outlines the physical dimensions required for resonance at 70 MHz, with the outer braid forming one half and the inner conductor forming the other. The feedline connection is directly to the coaxial dipole's center, maintaining a 50 ohm characteristic impedance. While the article does not present SWR plots or VNA sweeps, it focuses on the mechanical construction and dimensional accuracy for achieving a functional 4-meter dipole. The design is intended for fixed station use, with no specific mention of polarization or height above ground, but implies a standard horizontal orientation for dipole operation. DXZone Focus: Web Article | 4m Coaxial Dipole | Construction Guide | 50 ohm Feed
 -
 Amateur radio direction finding, transmitter hunting. triangulating a radio signal direction and plotting its bearing on a map. hunters use doppler systems for tracking hidden transmitters
 -
 Upload an ADIF fiel and plot all worked grids in an online map. Support filtering by band, year and can export the output directly into a google map, or a google earth KML file
 -
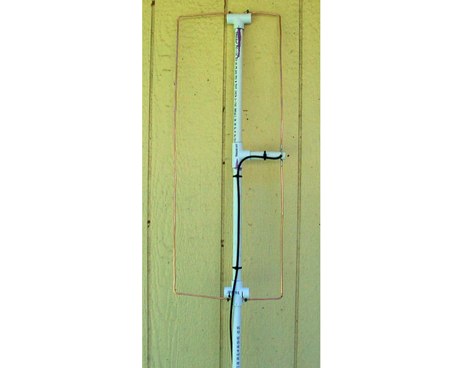
 Designing and constructing a two-element receiving loop antenna array for HF operation involves specific considerations for achieving high directivity and noise reduction. This resource details a homebrew system comprising two 30-inch diamond-shaped loops, spaced 20 feet apart, which are fed through mast-mounted preamplifiers and passive signal combiners. The operational principle relies on adjusting phase delays between elements via precise _Belden 8241_ coaxial cable lengths, optimized for specific bands from 160m to 20m. Performance data, derived from _EZ-NEC_ modeling, illustrates consistent 90° azimuth-plane beamwidth and low take-off angles across the target bands, with _Receiving Directivity Factor_ (RDF) values comparable to a 300-foot Beverage antenna. The article presents detailed elevation and azimuth plots for 20m, 30m, 40m, 80m, and 160m, demonstrating the array's ability to provide strong response at low DX angles while also supporting _NVIS_ signals. Key components like the _DX Engineering RPA-1_ preamplifier and _DXE RSC-2_ signal combiner are discussed, alongside the importance of impedance matching to preserve antenna patterns. The construction emphasizes self-contained elements that do not require ground radials, offering a compact solution suitable for suburban environments and stealth installations, with a focus on optimizing receive performance independently from transmit antennas.
 -
 An experimental antenna for HF reception. It consists of a single loop element mounted on the ground. It is stealthy, small, and quiet. EZ-NEC plots and on-air test results are included.
 -
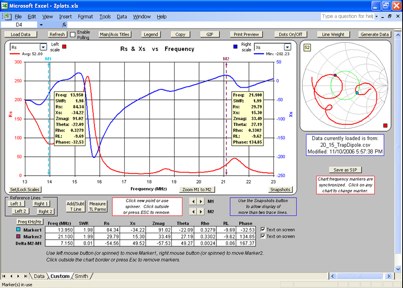
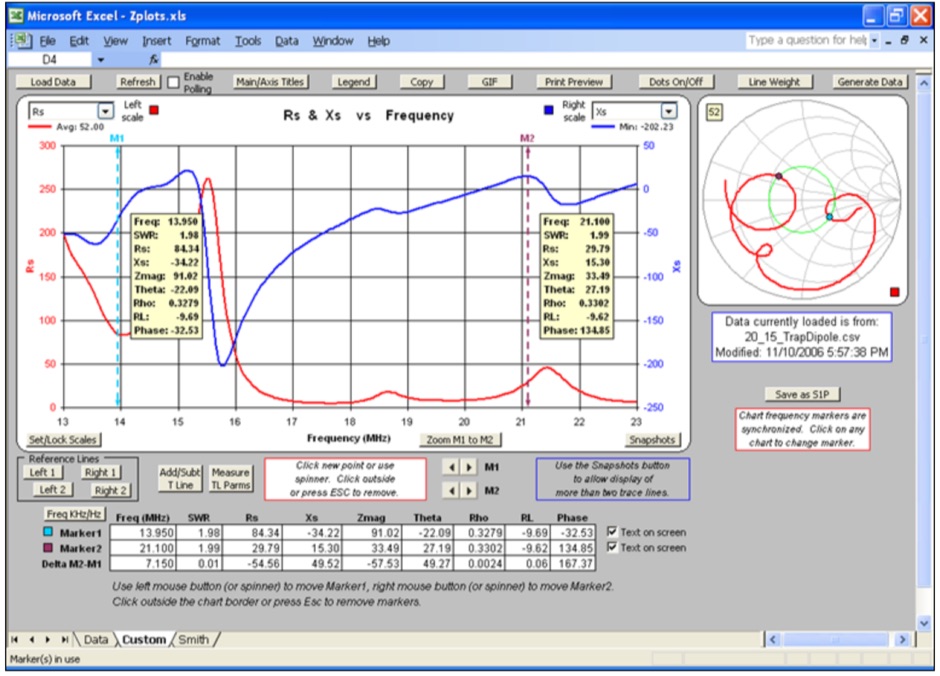 Zplots is an Excel application that allows you to plot impedance and related data obtained from a variety of sources. You can plot on both an XY chart and a Smith chart as well as view the data in tabular format. The XY chart can be customized with your choice of trace lines. Frequency (in MHz) is always shown on the X axis.
 -
 AN-SOF is a professional comprehensive software tool for the modeling and simulation of antenna systems. AS-SOF allows to describe antenna geometry, Choose construction materials, Describe the environment and ground conditions, Describe the antenna height above ground, Analize radiation pattern and front-to-back ratio, Plot directivity and gain, Analize input impedance and VSWR,Predict antenna bandwidth