Solar Cycle Progression
NOAA
3.0
(1 votes)
250 Hits
Description
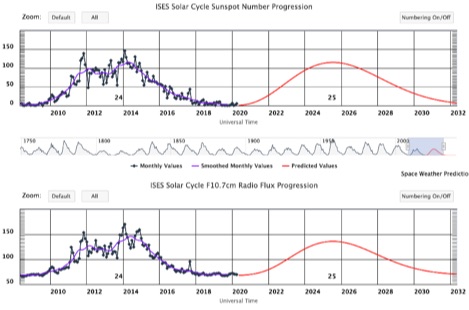
A dynamic graph of current and past solar cycle sunspot number progression and F10.7 cm radio flux progression. In both plots, the black line represents the monthly averaged data and the purple line represents a 13-month weighted, smoothed version of the monthly averaged data.
Visit Resource
Opens in a new window
Ratings & Reviews
3
1 votes
5 ★
0
4 ★
0
3 ★
1
2 ★
0
1 ★
0
Share Your Opinion
No reviews yet. Be the first!