Guide to Smith Chart - history and usage
YO3DAC
Rate this
115 Hits
Description
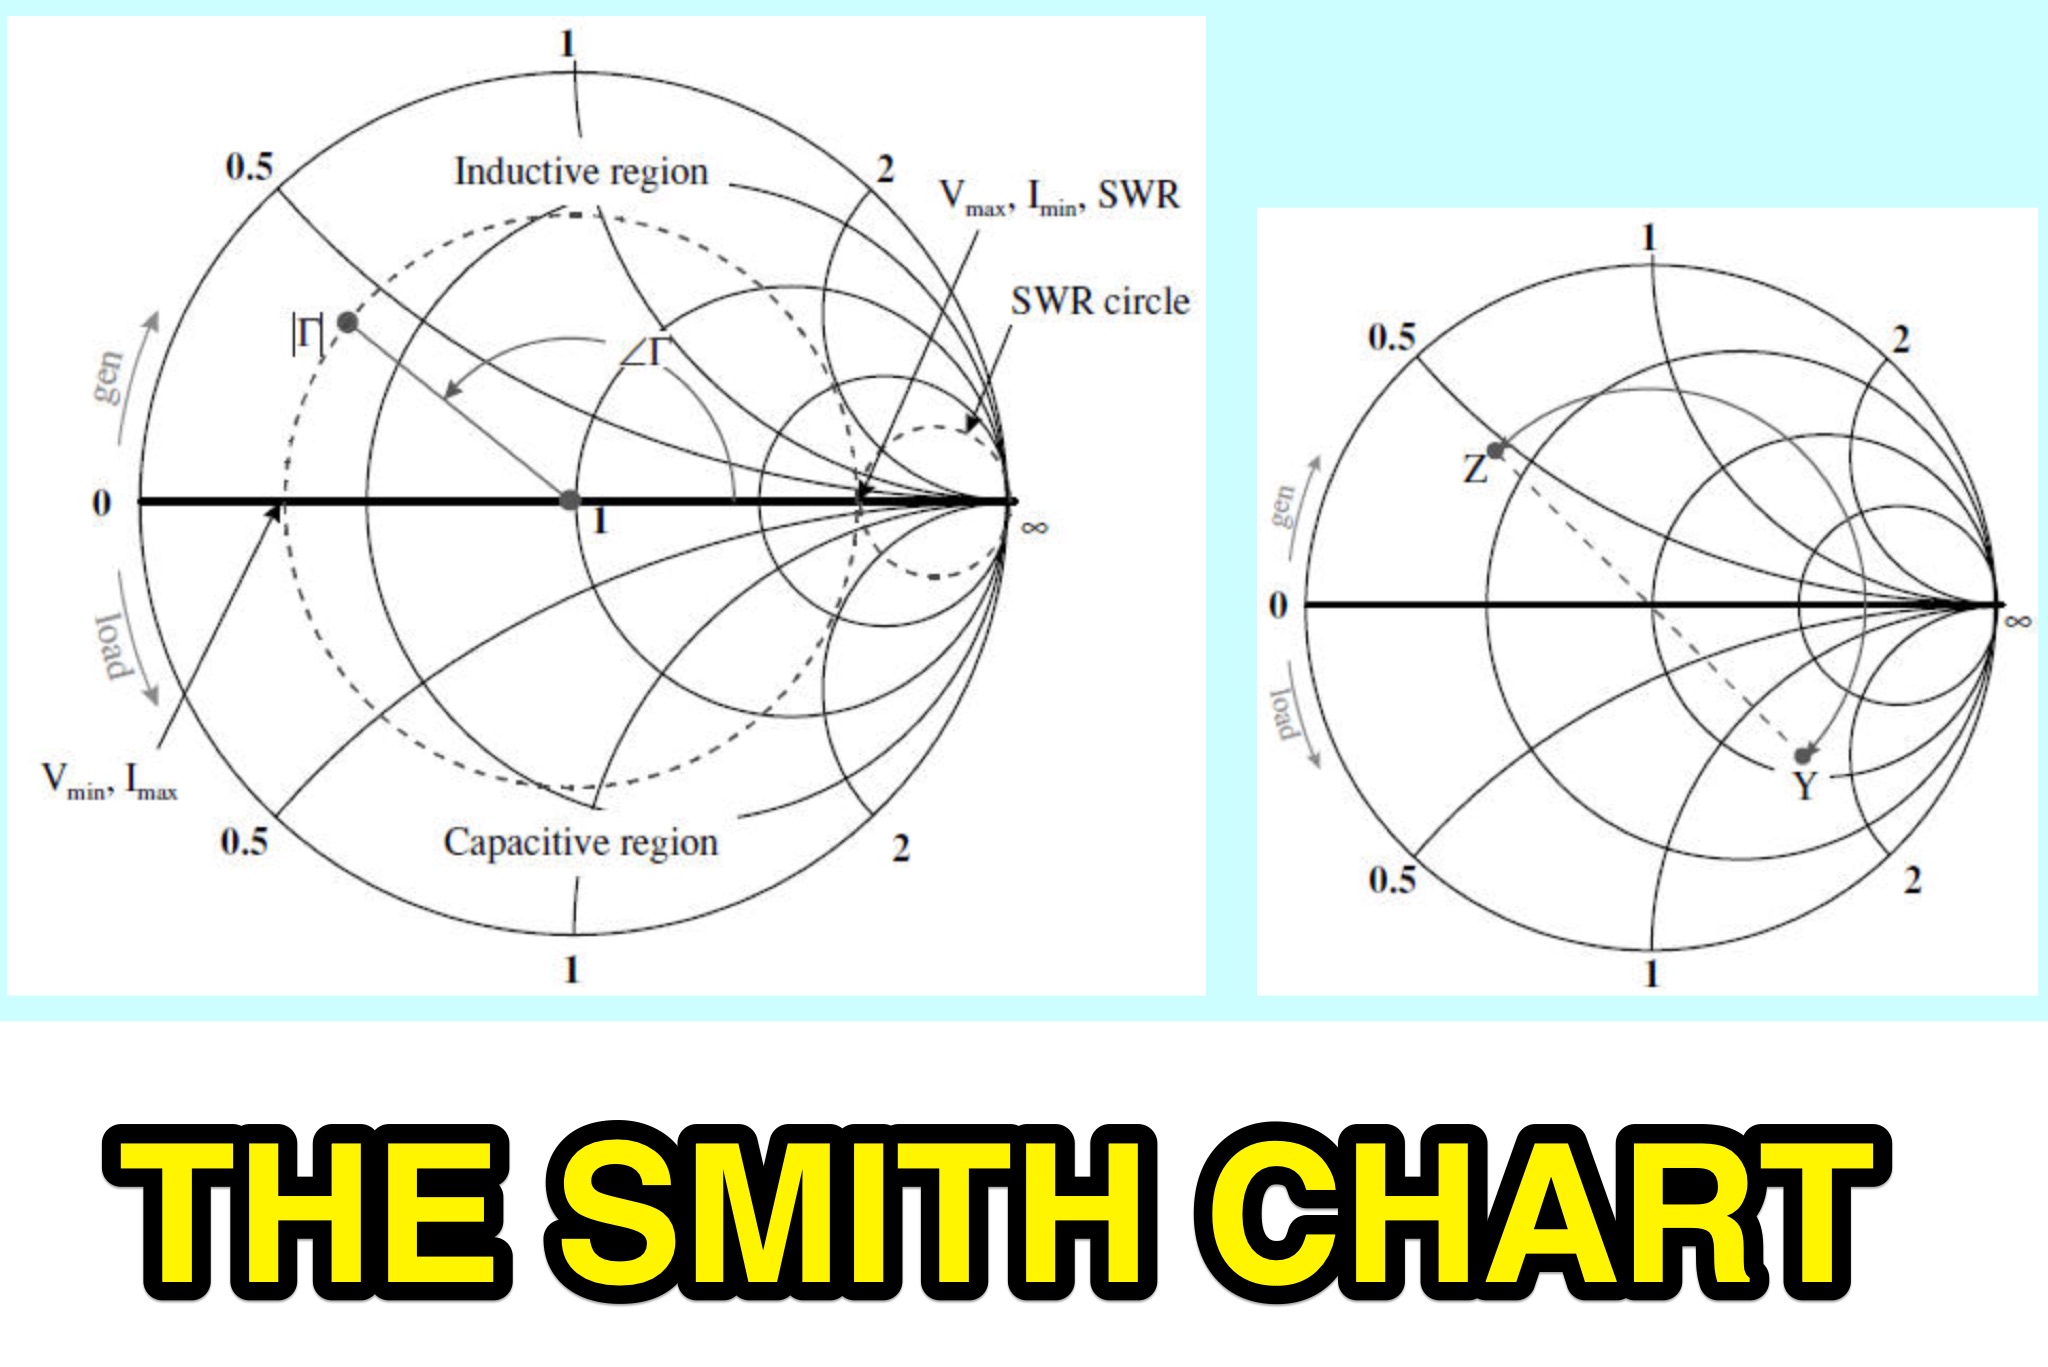
The Smith Chart, named after its inventor Phillip H. Smith, is a graphic tool used to solve transmission line problems in the field of ham radio operations. By using the Smith Chart, ham radio operators can determine the feed point impedance of an antenna, design impedance-matching networks, and optimize power transfer between a source and its load. The chart consists of resistance and reactance circles, providing a visual representation of complex mathematical relationships related to transmission line operations. Understanding and utilizing the Smith Chart is essential for hams looking to enhance the performance of their RF circuitry.
Visit Resource
Opens in a new window
Ratings & Reviews
Share Your Opinion
No reviews yet. Be the first!