NanoVNA-Saver: Vector Network Analyzer Data Acquisition and Analysis Software
Software for NanoVNA data acquisition, analysis, and Touchstone file export
Description
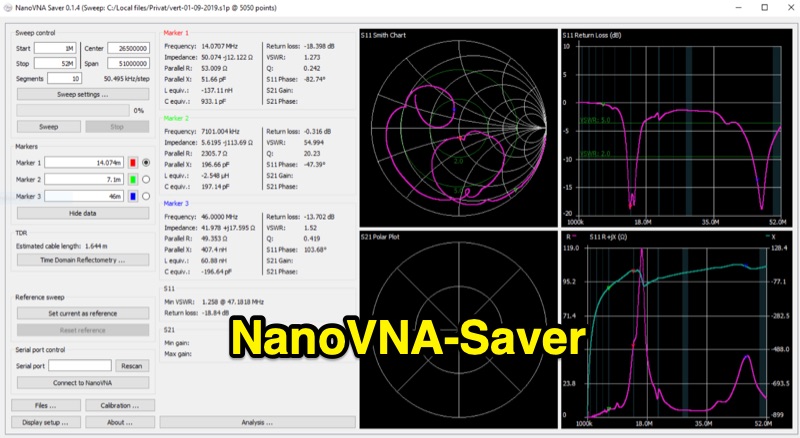
Facilitates interfacing with various NanoVNA models, including NanoVNA-H, NanoVNA-H4, NanoVNA-F, AVNA, and LiteVNA, to extract and display measurement data on a computer. The application supports splitting frequency ranges into multiple segments, increasing resolution beyond the standard 101 data points, with reported tests achieving up to 10,000 points for detailed analysis. Data averaging is also implemented to improve measurement accuracy, particularly beneficial at higher frequencies where noise can be more prevalent.
Displays data across several chart types, such as Smith, LogMag, Phase, and VSWR charts, for both S11 and S21 parameters. Markers provide specific readouts for impedance, VSWR, Q factor, and equivalent capacitance or inductance at selected frequency points. Users can define and display customizable frequency bands as reference overlays on the charts.
Developed in Python 3 (specifically >=3.10), the software leverages pyside6 for its graphical user interface, numpy for numerical operations, and scipy for scientific computing. This robust framework ensures stable performance and accurate data processing for amateur radio operators and electronics enthusiasts performing antenna and circuit characterization.