Search results
Query: LogView
Links: 3 | Categories: 0
-
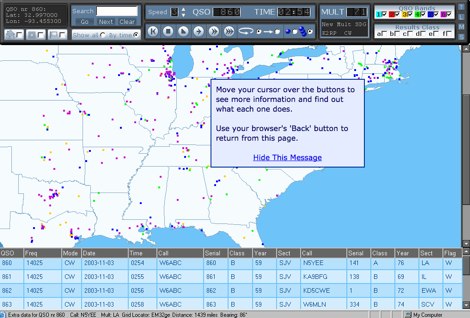 LogView is a free post-contest log-visualisation tool, for analysing contest performance. It plots the QSOs in a Cabrillo-format contest-log on to one of 8 different maps by finding the position of each QSO from an online database of about 970,000 W/VE callsigns.
 -
 Over 47 full-screen maps are available within _NAOMI_ (North American Overlay Mapper), a free Windows program designed for US and Canadian amateur radio enthusiasts. This mapping suite includes 9 backgrounds such as CQ Zones, ITU Zones, and ARRL Sections, along with 16 foreground layers like Counties, Areacodes, and Grid Locators. Users can calculate distances and bearings, track real-time mouse positions with continuous Grid-Locator data, and integrate with APRS for live station tracking via the FindU database. For a global perspective, the _Global Overlay Mapper_ (GOM) provides a world map, 8 continental maps, and 29 sub-continental maps, all with 12 active layers including Country Outlines, CQ/ITU Zones, and Prefix information. Both NAOMI and GOM offer feature-locate systems to jump to positions based on prefixes, capital cities, or Grid Locators, and provide customized beam headings and distance displays. The site also features _LogView_, a post-contest log visualization tool that analyzes Cabrillo-format logs by plotting QSOs on maps, supporting over 30 major contests like CQWW and ARRL DX, and allowing comparison with published results.
 -
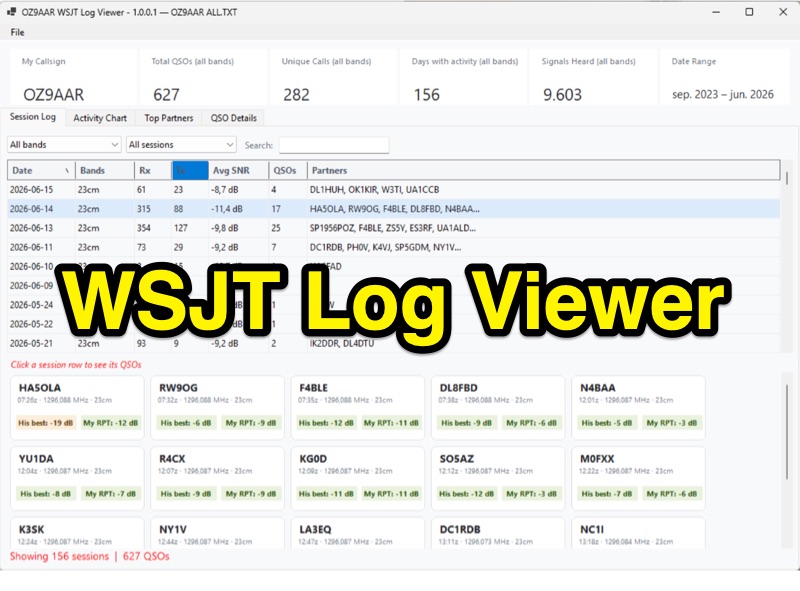 The WSJT Log Viewer, version 1.0.0.10 as of 2026-08-02, is a freeware Windows application developed by Carsten Groen (OZ9AAR) for analyzing signal strengths from WSJT digital mode contacts. It processes the ALL.TXT log file generated by WSJT-X, extracting and presenting data from decoded TX and RX messages. Initially designed for EME operations on 70cm and 23cm, the software has expanded to include all HF bands, 6m, 4m, 2m, 1.25m, 70cm, 23cm, 24GHz, and 47GHz. Key features include displaying total QSOs, unique callsigns, days with activity, and signals heard, with filtering options by band and completed QSOs. The application also monitors the ALL.TXT file for live updates every two seconds, reflecting new decodes in real-time. Users can view session logs, activity charts showing daily signal counts and decoded signals, and a "Top Partners" tab listing the 25 most frequent contacts. The software provides detailed QSO information, including best received SNR and sent reports, with graphical representations of SNR over time. It supports multiple "My Callsign" entries within a single ALL.TXT file and offers a function to generate a text list of initials worked per band. The program is distributed as a single executable file, requiring no installation, and stores its configuration in a LogViewer.cfg file, allowing for different setups via command-line arguments.