Search results
Query: map icons
Links: 3 | Categories: 0
-
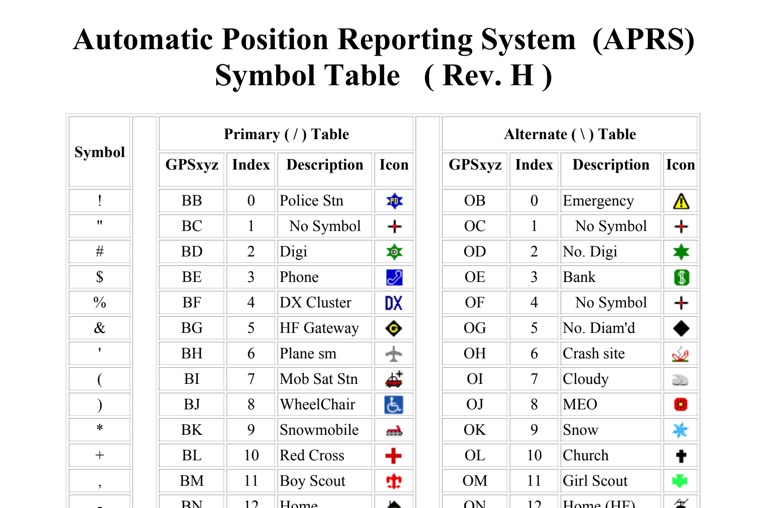 The four-page _APRS Symbol Table_ (Revision H) systematically lists 96 primary and 96 alternate Automatic Packet Reporting System symbols, each with its corresponding GPSxyz Index, a concise description, and a visual icon. For instance, the primary symbol '!' (GPSxyz BB) represents a "Police Stn," while its alternate counterpart '!' (GPSxyz OB) signifies "Emergency." The resource clearly delineates how specific ASCII characters map to distinct graphical representations on APRS displays, crucial for accurate situational awareness. It presents a direct, tabular format, making it an efficient reference for operators needing to quickly identify or interpret the myriad of icons used in APRS mapping applications. The table covers a broad spectrum of common APRS entities, from fixed stations like "Digi" (#) and "Home" (-) to mobile units such as "Car" (>) and "Plane sm" ('), alongside various weather phenomena and emergency services. Compiled by VK4KTP and featuring images by WA8LMF, the document serves as a definitive guide for understanding the visual language of APRS. It is particularly useful for those involved in tactical communications, public service events, or general APRS tracking, ensuring consistent symbol interpretation across different platforms and user interfaces.
 -
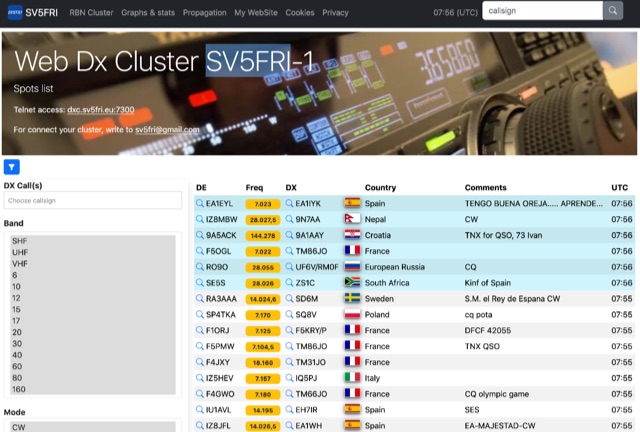 Operating a web-based DX cluster, this resource presents real-time amateur radio DX spots, facilitating contact logging and propagation analysis. It leverages the Spiderweb platform, offering users the ability to filter DX spots based on various criteria, including inclusion and exclusion rules. The interface integrates directly with QRZ.com for immediate callsign lookups, displaying flag icons for geographical context, and provides charts and statistics derived from spot data. Further enhancing its utility for DXers and contesters, the cluster includes direct links to MUF (Maximum Usable Frequency) maps and HamQSL solar condition reports. These external data sources provide critical propagation insights, assisting operators in making informed decisions about band selection and operating times. The service also offers Telnet access at dxc.sv5fri.eu:7300 for those preferring a command-line interface.
 -
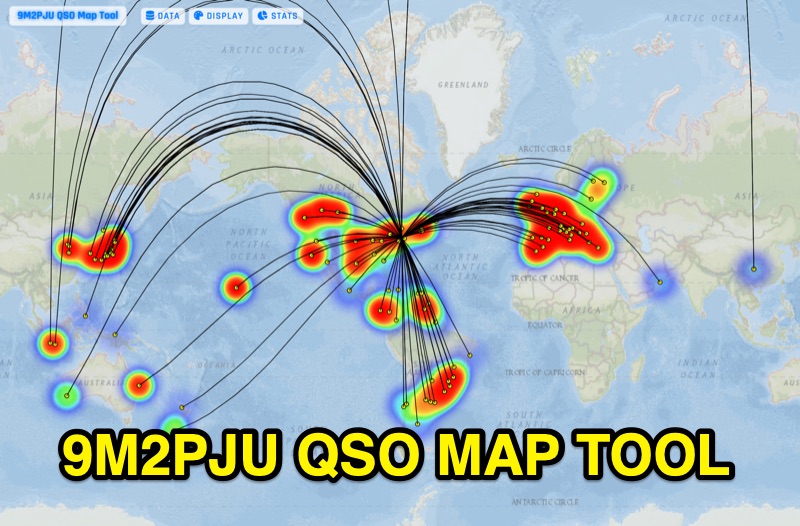 Presents the 9M2PJU QSO Map Tool, a web-based utility designed by Ian Renton for visualizing amateur radio contacts. This tool processes ADIF, Cabrillo, and SOTA CSV log files, allowing operators to plot their QSOs on a selection of base maps, including ESRI NatGeo World Map and OpenStreetMap Mapnik. Users can configure display options such as simple dot markers or xOTA hunter markers, QTH location, outlines, shadows, and geodesic lines, with coloring by band or a fixed hue. The application supports drawing per-band heatmaps and offers overlays for Maidenhead grid squares, CQ zones, ITU zones, and Worked All Britain/Ireland grids. It also provides QSO filtering capabilities and displays comprehensive log statistics, including unique calls, grid squares, CQ zones, ITU zones, and worked DXCCs. Customizable band and mode colors, alongside specific xOTA icons for programs like POTA, SOTA, WWFF, IOTA, and WCA, enhance the visual analysis of operating activity.