Search results
Query: zone chart
Links: 5 | Categories: 0
-
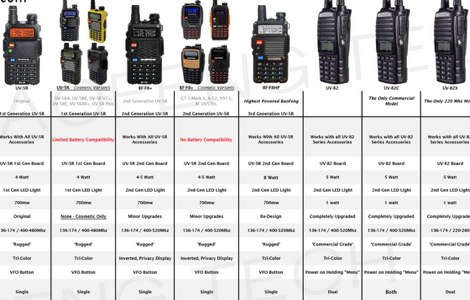 UV-5R models comparison chart
 -
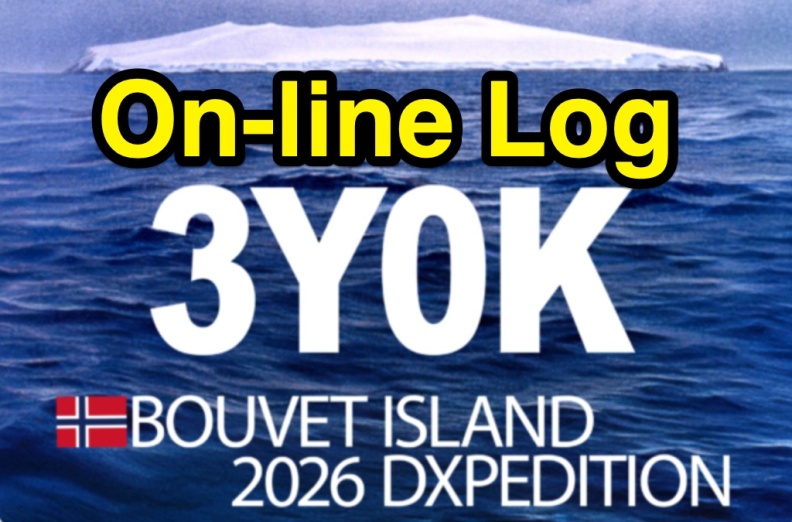 The 3Y0K Log Online provides a detailed logsearch interface for the **3Y0K** DXpedition to Bouvet Island, scheduled for February 2026. This web-based tool, hosted on _Club Log_, allows users to access real-time QSO statistics and leaderboards. The interface includes interactive features such as a map for checking real-time propagation and colored boxes that reveal mode and time breakdowns when hovered over. The service supports HF bands and provides a structured overview of QSOs, including band/mode breakdowns and continent-specific data. Users can report logging inquiries and QSL requests exclusively through the M0OXO Online QSL Request System (**OQRS**). The site also offers additional resources like band plans, operating practices, and FT8 advice. The leaderboard feature, which includes clubs and Contest Club, ranks stations based on the number of band slots worked, with duplicate QSOs being discouraged. The expedition's impact on users' totals is also tracked, providing insights into new bands, modes, and DXCC entities worked. DXZone Focus: 3Y0K DXpedition | Club Log | Bouvet Island
 -
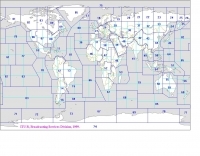 Explore this high-resolution ITU Zones Map, a critical reference resource for amateur radio operators, international broadcasters, and telecommunications engineers. Originally established by the International Telecommunication Union – Radiocommunication Sector (ITU-R) Broadcasting Services Division (1999), this chart accurately divides the globe into 90 specific CIRAF zones. This authoritative visual guide is indispensable for planning High Frequency (HF) radio propagation, scheduling international broadcasts, and verifying locations for radio contests and awards. Distinct from the 40 CQ Zones, the ITU zoning system provides the official administrative framework used for global frequency management. This digitally enhanced version ensures maximum clarity of zone boundaries and numbering (e.g., Zone 28 for Central Europe), making it an essential tool for technical accuracy in logbooks and station management. It serves as a trustworthy standard for educators, hobbyists, and industry professionals alike.
 -
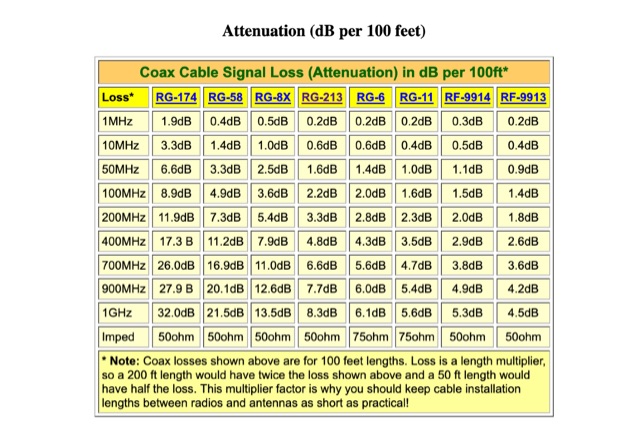 The resource provides coaxial cable attenuation data, listing signal loss in dB per 100 feet for various cable types across a frequency range from 1 MHz to 5.8 GHz. The initial table details attenuation for cables such as _RG-58_, _RG-8X_, and RG-213, with impedance values of 50 ohm or 75 ohm, at frequencies up to 1 GHz. For example, _RG-58_ exhibits **0.4 dB** loss at 1 MHz and **21.5 dB** loss at 1 GHz per 100 feet. A subsequent table expands on this data, including LMR series cables like _LMR-400_ and LMR-600, along with other types such as 9913F7 and RG214. This section covers frequencies from 30 MHz to 1,500 MHz, also noting the outer diameter of each cable. For instance, _LMR-400_ (0.405" diameter) shows **0.7 dB** loss at 30 MHz and 5.1 dB loss at 1,500 MHz per 100 feet. The final section focuses on VHF/UHF/Microwave amateur and ISM bands, presenting attenuation in dB per 100 feet (and meters) for frequencies including 144 MHz, 450 MHz, and 2.4 GHz. This table includes larger diameter hardline options like 1/2" LDF and 7/8" LDF, in addition to flexible coaxial cables. For example, 1/2" LDF cable demonstrates **0.85 dB** loss at 144 MHz and 6.6 dB loss at 2.4 GHz per 100 feet. DXZone Focus: Coaxial cable attenuation | LMR-400 | RG-58 | 5.8 GHz
 -
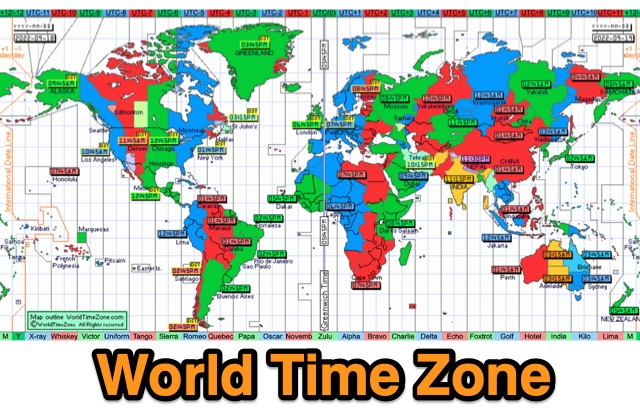 World Time Zone is an online quick reference chart that displays the world time zones in detail. DST is also indicated by yellow markers on the map. UTC difference is marked with different colors, and if you point and click will show up area details