Search results
Query: analyzer calibration
Links: 9 | Categories: 1
-
 Demonstrates _Freq51_ and _Specgrm2_, two analysis programs from the Biomedical Ultrasonics Laboratory at the University of Michigan, available for DOS or Linux. The _Spectrum Analyser (Freq51)_ provides power spectrum levels as a function of frequency, configurable for absolute values (e.g., dB re 1 volt) with sound card calibration. _Spectrogram (Specgrm2)_ generates a real-time, full-screen spectrogram (sonagram) with various color options. These programs analyze incoming signals in real time, not stored files, and offer extensive settings for sampling rate, FFT points, and averaging time, making them highly versatile for acoustic analysis. The DOS version of _Freq51_ and _Specgrm2_ can operate under Windows 95, requiring users to configure sound card switches via a text file. The resource also briefly mentions other acoustic analysis software like Gianni Pavan's DOS-based bioacoustic tools, _Gram_ by R.S. Horne for Windows, _SASLab_ (Light and Pro versions), _Cool Edit_, and _GoldWave_, providing a comparative overview of available tools for real-time and file-based spectral analysis and waveform manipulation.
 -
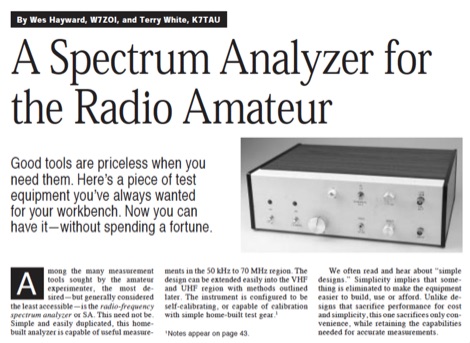 Demonstrates the construction of a **homebrew spectrum analyzer** designed by Wes Hayward, W7ZOI, and Terry White, K7TAU, enabling radio amateurs to build a capable test instrument without significant expense. The resource details a _double-conversion superheterodyne_ circuit, employing intermediate frequencies of 110 MHz and 10 MHz, and covers essential blocks such as the time base, logarithmic amplifier, resolution filters, and local oscillators. It highlights the use of hybrid and monolithic ICs, including mixers, amplifiers, and VCOs, to simplify construction while maintaining performance. The design supports useful measurements in the 50 kHz to 70 MHz range, with methods outlined for extending capabilities into VHF and UHF. The authors emphasize that this analyzer, while simple to build, is intended for serious measurements, requiring careful control of signal levels to avoid spurious responses. It uses an oscilloscope for display, with specific instructions for calibration and adjustment of various stages, including the log amplifier and IF gain. The guide provides detailed schematics and component lists for each section, such as the 110 MHz triple-tuned band-pass filter, which achieved **90 dB** image rejection, a significant improvement over double-tuned circuits. Practical advice on alignment and troubleshooting is included, drawing on the authors' extensive experience in RF circuit design.
 -
 Constructing a functional spectrum analyzer for the 0-100 MHz range presents a significant challenge for radio amateurs, often requiring specialized components and careful calibration. This project details a homebrew spectrum analyzer design utilizing common integrated circuits like the _SA605D_ FM receiver IC and _MAR-6_ MMIC amplifiers, aiming for a cost-effective solution. The design incorporates a low-pass filter, RF amplification, a voltage-controlled oscillator (VCO) for downconversion, and multiple IF stages at 150 MHz and 10.7 MHz, with a resolution bandwidth (RBW) of 15 kHz. Critical components such as the _SBL-1_ mixer and varicap diodes are specified, alongside instructions for winding inductors and tuning filters. The analyzer's performance is discussed in terms of input level limitations, specifically the 1dB-compression point and third-order intercept point, to ensure accurate measurements and prevent component damage. The _SA605D_'s logarithmic Received Signal Strength Indicator (RSSI) output serves as the detector, driving the Y-input of an oscilloscope, while a _TL084_ op-amp generates the sweep signal for the X-input. Potential enhancements include adding a step attenuator, improving front-end filtering, and implementing switchable IF filters for variable RBW, allowing for greater versatility in analyzing RF signals.
 -
 Accurately determining an antenna's feedpoint impedance is crucial for optimal performance, especially when experimenting with new designs or making adjustments. While SWR meters provide basic information, a full complex impedance measurement reveals the resistive and reactive components, which are essential for proper matching. Modern antenna analyzers, like the _Palstar ZM30_ or MFJ259B, simplify this task, but measurements taken through a transmission line require careful interpretation due to impedance transformation. This resource details a calibration method to precisely account for the effects of the feedline. It explains how a transmission line can significantly alter the measured impedance, illustrating this phenomenon with a Smith Chart example where an 80m antenna's [22 + j6] Ohms feedpoint impedance transforms to [82 + j45] Ohms after a 10m line. The guide demonstrates using a transmission line calculator applet, such as the one by W9CF, to reverse this transformation. It outlines the process of calibrating a specific length of RG174 coax, showing how an initial 26ft estimate was refined to **25.85ft** to accurately predict a known 22 Ohm load, significantly improving accuracy over uncalibrated results.
 -
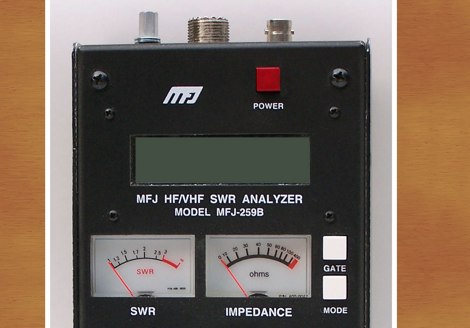 The correct way to calibrate the MFJ-259B analyzer
 -
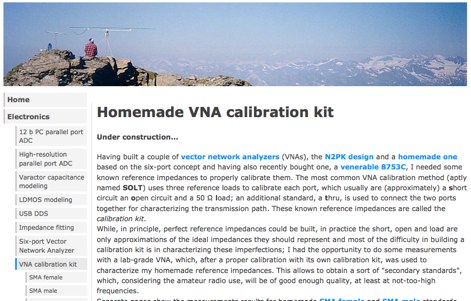 A calibration kit useful when you need known reference impedances to properly calibrate your vector network analyzers.
 -
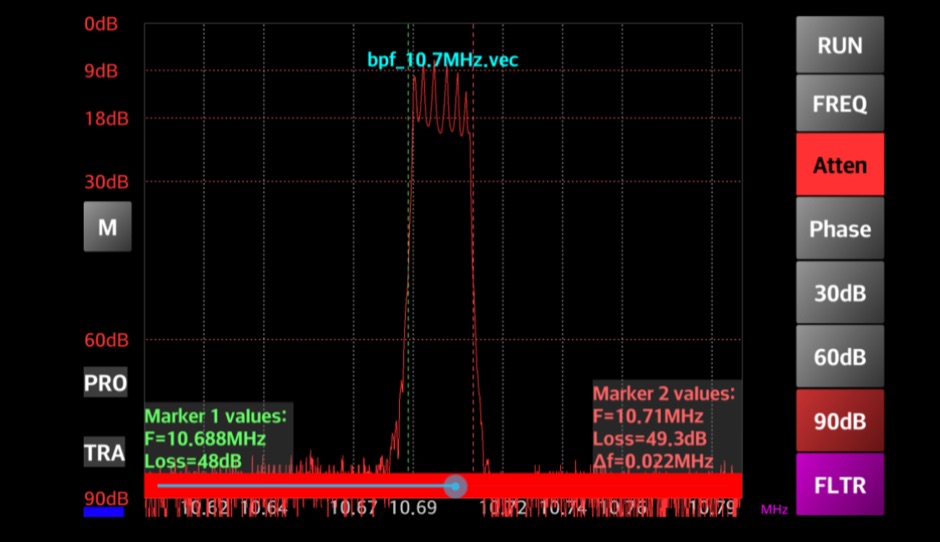 Enables Android users to operate various _miniVNA_ antenna analyzers via Bluetooth, USB, or Wi-Fi, providing a portable solution for RF measurements. The application supports full control over data acquisition, offering features like custom frequency range selection from 1 KHz to the VNA's full range, and automatic screen adaptation for diverse Android device resolutions. It facilitates intuitive, wizard-based calibration for both reflection and transmission modes, saving calibration data for different VNA types (Standard, Pro, Pro with Extender) to avoid repeated procedures. The software displays critical parameters such as SWR, |Z|, Return Loss, Phase, Rs, and |Xs| on 2-axis graphs or Smith charts, with multi-touch gestures for zoom and frequency shift. It includes a frequency generator mode with independent channels and attenuator control for the miniVNA Pro, along with a sweeper function. The cable data mode automatically calculates phase and loss, measures cable length from less than 1 meter to hundreds of meters, and includes a table of common coax cable velocity factors. An experimental X-tal mode measures resonance frequency, Rs, and Q. Data export options include CSV, ZPLOT, and S1P formats, with CSV import capability. The application also features an SM6ENG Audio mode for SWR tuning without visual reference and provides a miniVNA battery voltage indicator. It supports a wide frequency range, with the miniVNA Extender extending coverage up to **1500 MHz**. The application is compatible with Android version 2.2 and later, tested on devices like the _Galaxy TAB 7.7 P6800_.
 -
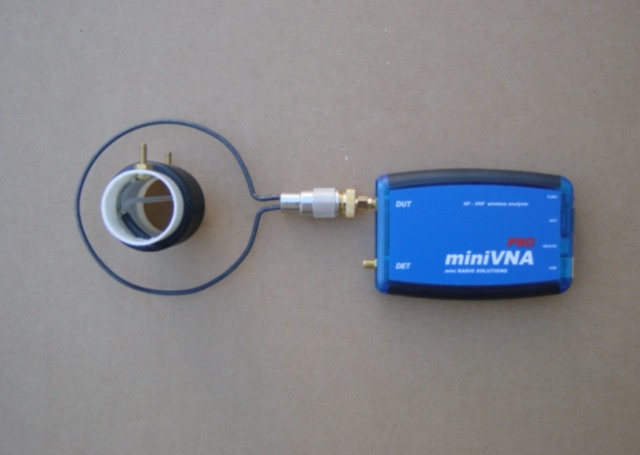 Notes on installing the miniVNA PRO software, making a calibration standard, a trap tuning loop.
 -
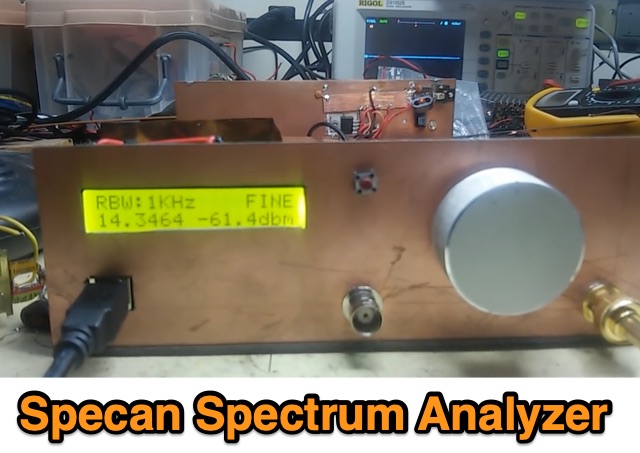 A homebrew spectrum analyzer, the Specan, provides a crucial measurement capability often missing from the typical amateur radio shack, allowing for detailed analysis of RF signals up to 70 MHz. This double-conversion superheterodyne receiver design incorporates 112 MHz and 12 MHz intermediate frequencies, utilizing an _Si570_ as the local oscillator for fine tuning down to 1 Hz steps. It offers two resolution bandwidths: 300 KHz for broad spectrum sweeps and 1 KHz for precise close-in distortion measurements, achieving an 80 dB spur-free dynamic range at 1 KHz resolution. The project, a reboot of the classic _W7ZOI/K7TAU_ design from November 1998 QST, integrates an _Arduino_ microcontroller for controlling the Si570, managing a front-panel LCD, and communicating with a PC for spectrum plotting. This approach significantly reduces cost compared to commercial units, making advanced RF diagnostics accessible to homebrewers. The Specan can measure carrier suppression, VFO cleanliness, antenna VSWR, transmitter harmonics, and filter passband shapes, providing insights beyond what an oscilloscope or frequency counter can offer. Construction emphasizes modularity and careful shielding, with each stage built and tested individually on unetched copper clad board. The design includes detailed instructions for integrating the Arduino, building the Si570 oscillator, and aligning the various modules, often using the Specan itself for calibration. It requires a well-regulated linear power supply and can be built with common tools and readily available components, making it a practical and rewarding endeavor for those looking to enhance their RF test bench.