Search results
Query: global maps
Links: 10 | Categories: 0
-
 DXMaps.com presents a dynamic, real-time mapping service for amateur radio DX spots, integrating data from traditional DX clusters, _PSK Reporter_, and WSPR networks. The platform visually plots global QSO and SWL activity, enabling users to observe propagation conditions across various bands, from 2200m to >450 MHz. It offers distinct overlays such as the magnetic equator, gray line, moon footprint for EME, and VOACAP propagation predictions, providing a comprehensive view of radio wave behavior. The service allows granular filtering of displayed spots, including options to show only DX-Cluster data, PSK Reporter activity, or WSPR signals. Users can refine the map view by selecting specific bands (e.g., 160m, 20m, 6m, 2m), limiting spots to the last 15 minutes, or displaying only contacts exceeding **2600 km**. Additional features include the ability to toggle grid squares, aurora forecasts, and various amateur radio zones (CQ, ITU). Distinctively, the resource updates automatically every minute, ensuring current propagation intelligence without manual refresh. It also supports specialized views for EME, ionospheric scatter, and aircraft scatter, alongside FM DX and APRS activity. The platform emphasizes the importance of accurate locator information in DX spots to enhance data quality and offers a user manual and FAQ for guidance.
 -
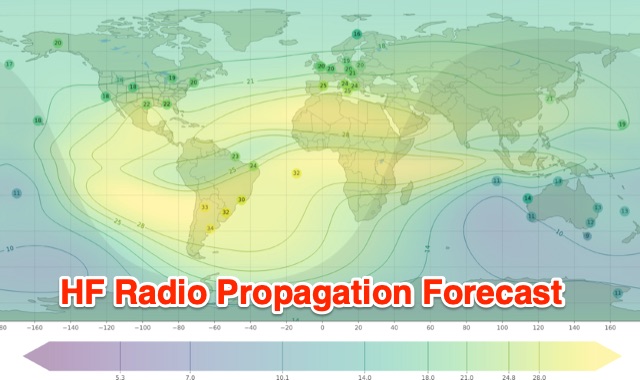
 These pages provide general propagation advice for HF communicators. Information available includes inferred global propagation conditions, real time HF fadeout coverage charts, regional ionospheric vertical MUF maps and Hourly Area Prediction charts for Astralia and Asia, Europe and North America
 -
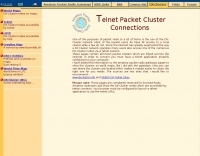 Illustrates the global distribution of **DX-Cluster** nodes through an interactive map interface, enabling radio amateurs to visualize and access real-time DX spots. The resource provides direct TELNET and HYPER links for each node, facilitating immediate connection to various clusters for up-to-the-minute propagation information and station activity. This visual approach simplifies the process of locating and connecting to a suitable DX-Cluster, whether for local or international DXing. Amateurs can use this tool to quickly identify active clusters in different geographic regions, which is particularly useful for **DXpedition** planning or contest operations. The direct links streamline access, bypassing manual configuration for many cluster types. It serves as a practical aid for operators seeking to monitor band conditions, find rare DX, or participate in competitive operating events by leveraging aggregated spotting data.
 -
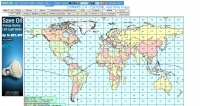
 Dynamic Map Progam with 34 maps, 442 overlays, and realtime position/locator info. Online Demo available. 0-59c per map.
 -
 Understanding high-frequency (HF) skywave propagation is crucial for amateur radio operators seeking to optimize long-distance communications. This resource details the fundamental principles of HF radio propagation, including the properties of electromagnetic waves, the characteristics of various HF bands, and distinct propagation modes such as skywave, ground wave, and line-of-sight. It places significant emphasis on the ionosphere's pivotal role in refracting HF waves, explaining how solar activity directly influences ionospheric conditions and, consequently, propagation paths. The resource integrates real-time monitoring capabilities, featuring dynamic charts and data from DX clusters, WSPRnet, and the Reverse Beacon Network, which allow users to track current band activity and propagation conditions globally. It also delves into advanced topics like Near Vertical Incidence Skywave (NVIS) and gray line propagation, providing insights into ionosonde data and various propagation prediction models. The site presents a detailed analysis of solar-terrestrial interactions, geomagnetic indices, and space weather phenomena, illustrating their direct impact on HF communication reliability. Practical tools and applications are highlighted, including real-time QSO planners, online Maximum Usable Frequency (MUF) maps, and alerts for solar flares or geomagnetic storms. The guide systematically breaks down complex concepts into accessible chapters, offering a structured approach to learning about ionospheric regions, diurnal and seasonal effects, and the interpretation of propagation indicators like foF2, MUF, and Lowest Usable Frequency (LUF). This makes it a robust reference for hams aiming to deepen their technical understanding and improve operational effectiveness.
 -
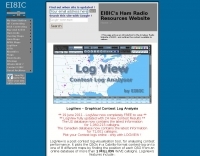
 Over 47 full-screen maps are available within _NAOMI_ (North American Overlay Mapper), a free Windows program designed for US and Canadian amateur radio enthusiasts. This mapping suite includes 9 backgrounds such as CQ Zones, ITU Zones, and ARRL Sections, along with 16 foreground layers like Counties, Areacodes, and Grid Locators. Users can calculate distances and bearings, track real-time mouse positions with continuous Grid-Locator data, and integrate with APRS for live station tracking via the FindU database. For a global perspective, the _Global Overlay Mapper_ (GOM) provides a world map, 8 continental maps, and 29 sub-continental maps, all with 12 active layers including Country Outlines, CQ/ITU Zones, and Prefix information. Both NAOMI and GOM offer feature-locate systems to jump to positions based on prefixes, capital cities, or Grid Locators, and provide customized beam headings and distance displays. The site also features _LogView_, a post-contest log visualization tool that analyzes Cabrillo-format logs by plotting QSOs on maps, supporting over 30 major contests like CQWW and ARRL DX, and allowing comparison with published results.
 -
 Live DX spots are presented through a _web cluster_ interface, utilizing both a world map and a Google Maps display for visualizing amateur radio propagation. The system provides real-time spotting data, enabling operators to track active stations globally. Users can observe current band conditions and station activity, which is crucial for optimizing contact strategies across various amateur bands. The platform's utility extends to contest operations and general DXing, offering a visual representation of where stations are being heard. While the primary function is DX spotting, the site also includes technical articles, such as instructions for interlocking two Flex Radios for single-transmitter compliance in contests, and a guide for constructing a simple **5KW** 1:1 balun for **160m/80m** dipoles using RG400 cable. This combination of live data and practical technical content supports both operational awareness and station improvement.
 -
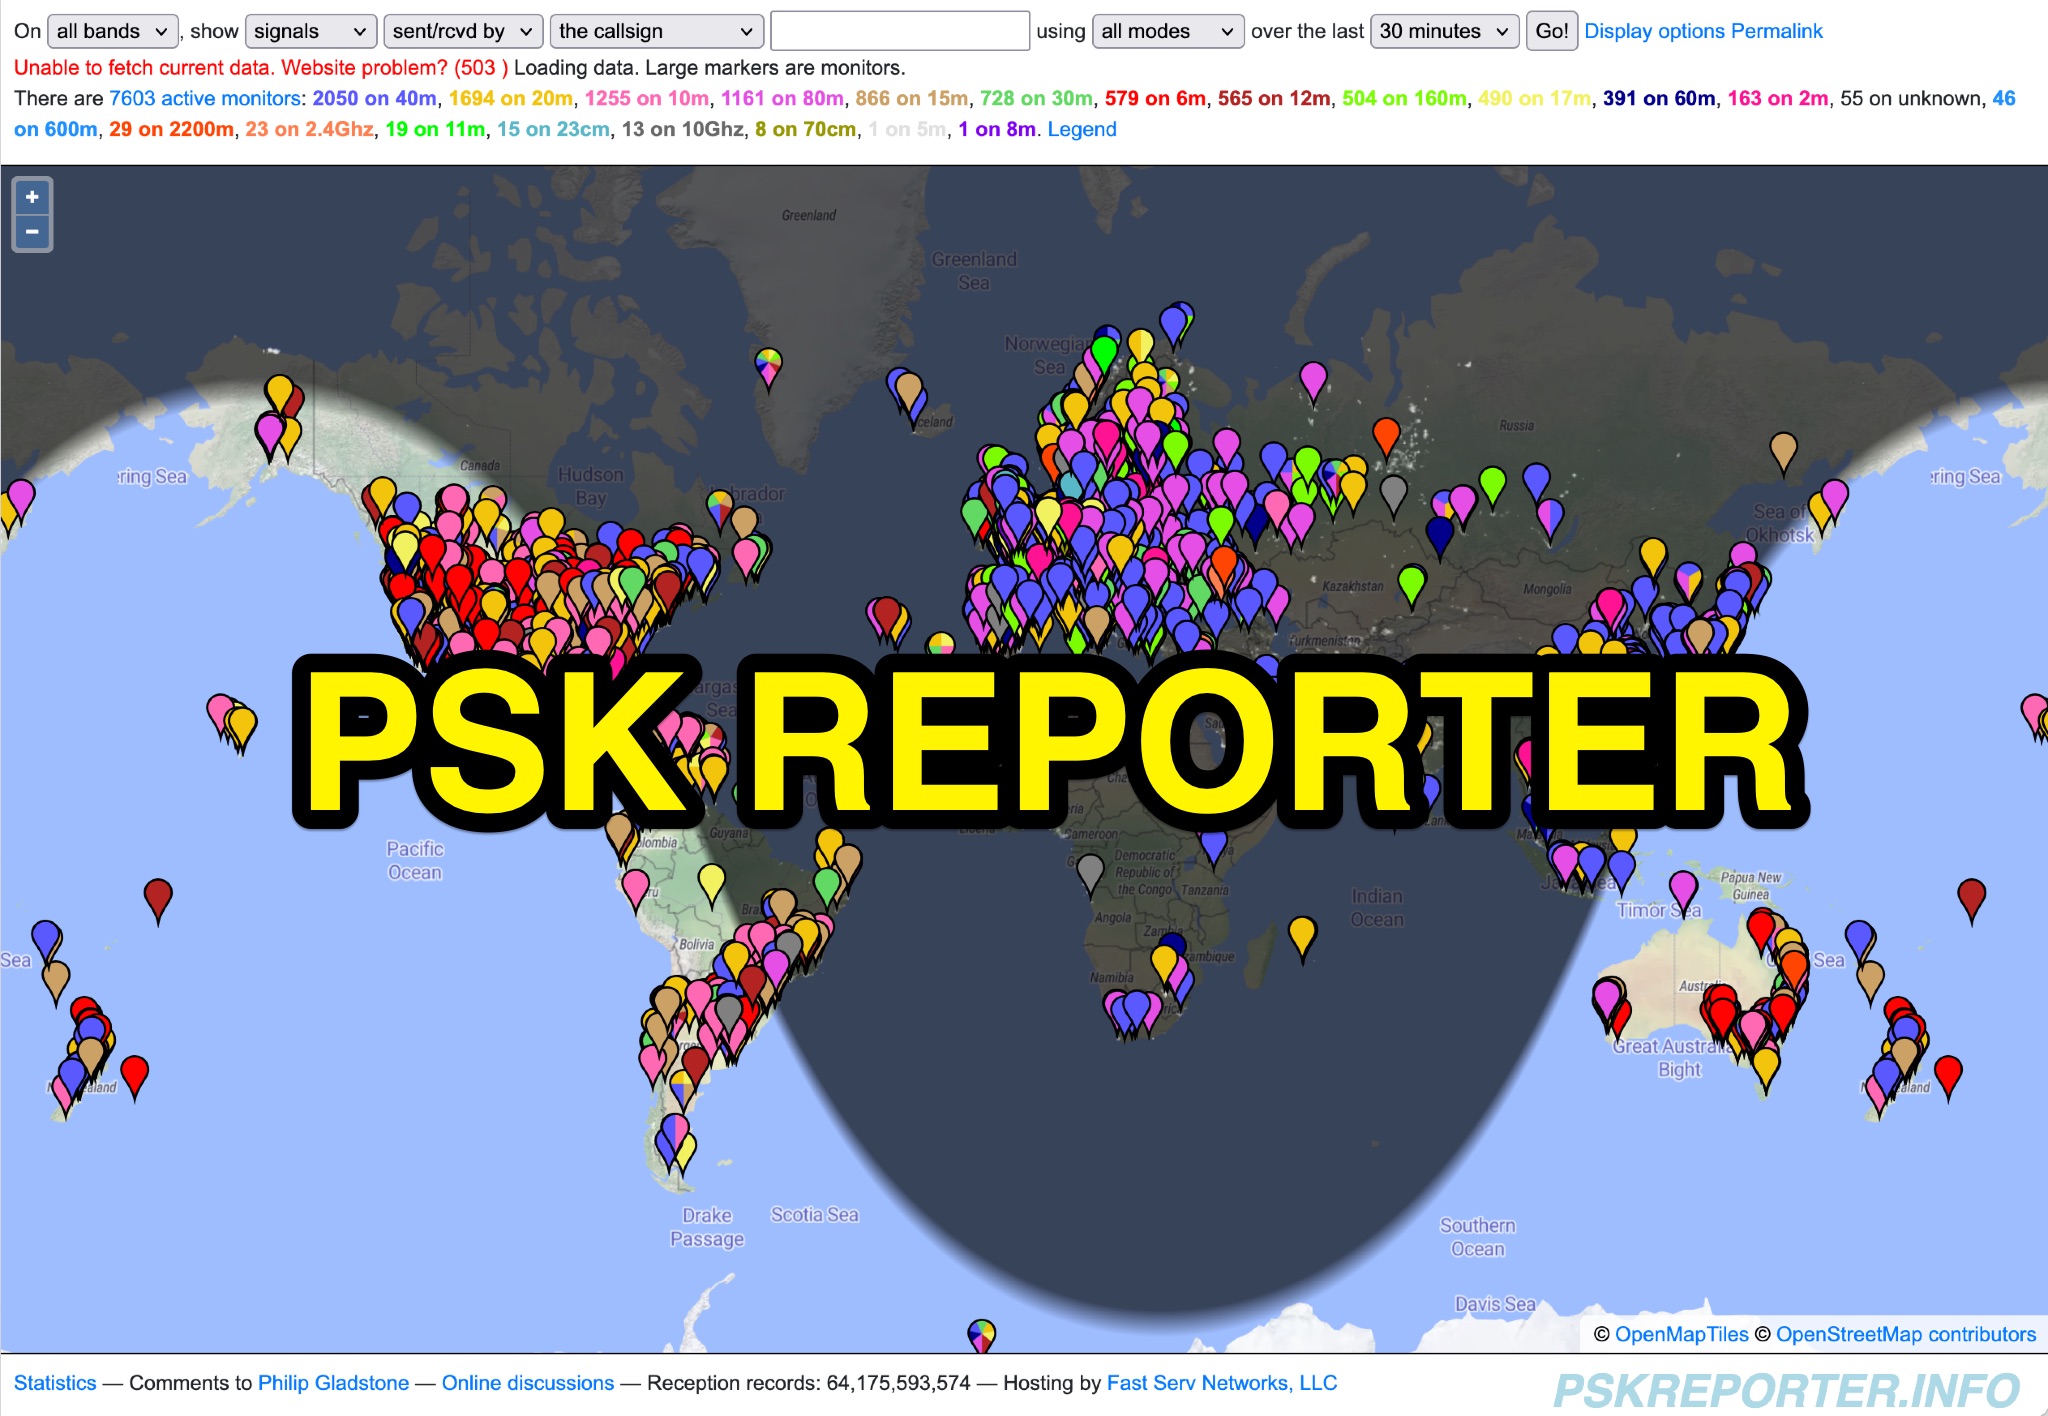 PSK Reporter provides a real-time visualization of amateur radio digital mode reception reports, aggregating data from a global network of monitoring stations. This platform is particularly useful for operators utilizing modes such as FT8, FT4, and PSK, allowing them to observe signal propagation paths and assess their station's reach. The interactive maps display reception reports, enabling hams to analyze band conditions and optimize antenna performance for various frequencies and times of day, aiding in understanding ionospheric conditions. Operators can filter reports by callsign, band, mode, and time, gaining insights into specific propagation events or evaluating the effectiveness of their transmit setup. The data collected helps in predicting optimal operating windows for DX contacts across various digital modes. Philip Gladstone is the contact person for comments and discussions regarding the system.
 -
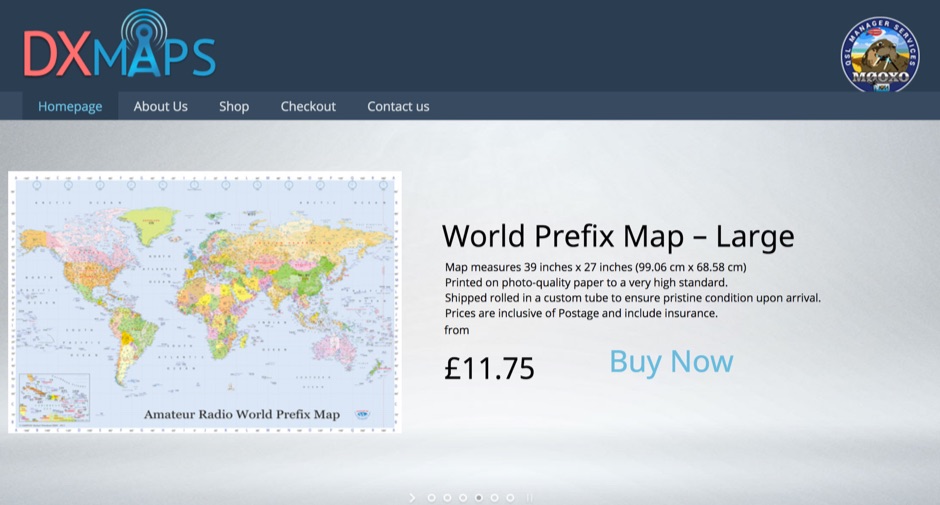 DX Maps provides a specialized map printing service, focusing on amateur radio applications such as world prefix maps and custom great circle projections. The platform allows radio operators to visualize propagation paths and DX entities relevant to their QTH and operational goals. This service supports the creation of high-quality, large-format maps tailored for shack display or operational planning. The service facilitates the generation of personalized maps, which can include specific callsign locations, beam headings, and other critical amateur radio data points. Users can specify parameters to create maps that aid in understanding global propagation conditions and optimizing antenna aiming for long-distance contacts. The UK-based operation ensures a localized service for European hams, with international shipping options available. DX Maps also offers QSL card printing, complementing its mapping services.
 -
 Over 44,000 square kilometers of Scotland's natural beauty provide a unique backdrop for the _GMFF_ award program. Designed for amateur radio operators who thrive on portable operations, this program encourages activators to set up stations in designated flora and fauna areas. Participants engage in _SSB_ and _CW_ modes, making contacts from these scenic locations, which are part of the _WorldWide Flora and Fauna_ network. Activators and chasers alike benefit from the program's structure, which awards points for successful contacts. The _GMFF_ program is part of a larger global initiative, allowing operators to contribute to conservation awareness while enjoying their hobby. With a focus on environmental preservation, the program aligns amateur radio activities with ecological interests, promoting responsible and sustainable operating practices. The program's website provides resources for participants, including maps of designated areas and guidelines for operation. By participating, operators not only enjoy the challenge of portable operation but also support the conservation of natural habitats. The _GMFF_ program thus combines the thrill of amateur radio with a commitment to environmental stewardship.