Search results
Query: node map
Links: 3 | Categories: 0
-
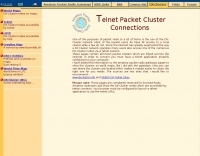 Illustrates the global distribution of **DX-Cluster** nodes through an interactive map interface, enabling radio amateurs to visualize and access real-time DX spots. The resource provides direct TELNET and HYPER links for each node, facilitating immediate connection to various clusters for up-to-the-minute propagation information and station activity. This visual approach simplifies the process of locating and connecting to a suitable DX-Cluster, whether for local or international DXing. Amateurs can use this tool to quickly identify active clusters in different geographic regions, which is particularly useful for **DXpedition** planning or contest operations. The direct links streamline access, bypassing manual configuration for many cluster types. It serves as a practical aid for operators seeking to monitor band conditions, find rare DX, or participate in competitive operating events by leveraging aggregated spotting data.
 -
 The Reverse Beacon Network (RBN) graph presents a dynamic visualization of amateur radio spots, specifically tracking CW, BPSK, and RTTY signals over the last 15 minutes. Users can filter these real-time spots by DX continent, spotter continent, and individual frequency bands, including **160m through 70cm**. The interface also offers a bandwidth reduction option, which is particularly useful for operators with limited internet connectivity. This resource provides a unique perspective on propagation conditions and station performance by aggregating data from various _Reverse Beacon Network_ nodes. It automatically refreshes every 10 seconds, ensuring that the displayed information is current and relevant for active DXers and contesters. The graph's Y-axis represents time, with each spot indicating activity within a one-minute interval. Beyond the primary RBN graph, the platform also features dedicated maps for both DXCluster and RBN data, including azimuthal projections. An additional FT8 graph is available, though noted as being under construction, indicating ongoing development to expand its utility for digital mode enthusiasts. The system was developed by HA8TKS, with the initial concept attributed to CT1BOH.
 -
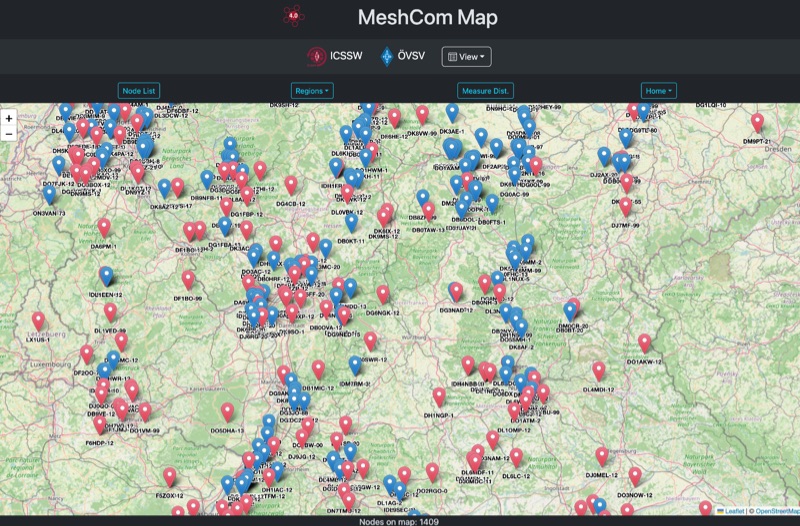 Approximately 100 MeshCom nodes are visualized in real-time on a geographical map, providing a dynamic overview of the LoRa mesh network. This resource, hosted by _OE1KFR_, details node positions, telemetry data, and message traffic. Users can measure distances between two selected nodes, view text messages with callsign, destination, and gateway information, and access position data including latitude, longitude, and altitude. The platform supports filtering by regions such as Europe, USA, and Asia, allowing operators to focus on specific geographical areas. The detailed node list table presents comprehensive status information for each node, including gateway callsign, firmware version, hardware type, and environmental telemetry like temperature, pressure, humidity, and CO2 levels. This granular data enables operators to monitor network health and individual node performance, facilitating troubleshooting and optimization of MeshCom deployments. The map interface enhances situational awareness for those engaged in LoRa mesh networking.