Visualize Ham Radio DX Clusters and Your QSO Logs
Access real-time DX cluster spots, analyze propagation, and map your amateur radio contacts on interactive world maps.
DX Maps provide amateur radio operators with visual representations of global ham radio activity. These tools display DX cluster spots in real-time, allowing users to monitor current band conditions and identify active stations worldwide. Many platforms offer customizable views, including azimuthal projections centered on your QTH, and filtering options by band, mode, or continent. Beyond live cluster data, these resources enable mapping of your own QSO logs by importing ADIF files, visualizing your contacts on interactive world maps. This functionality is crucial for tracking DXCC progress, analyzing propagation patterns, and enhancing situational awareness during contests or daily operating.
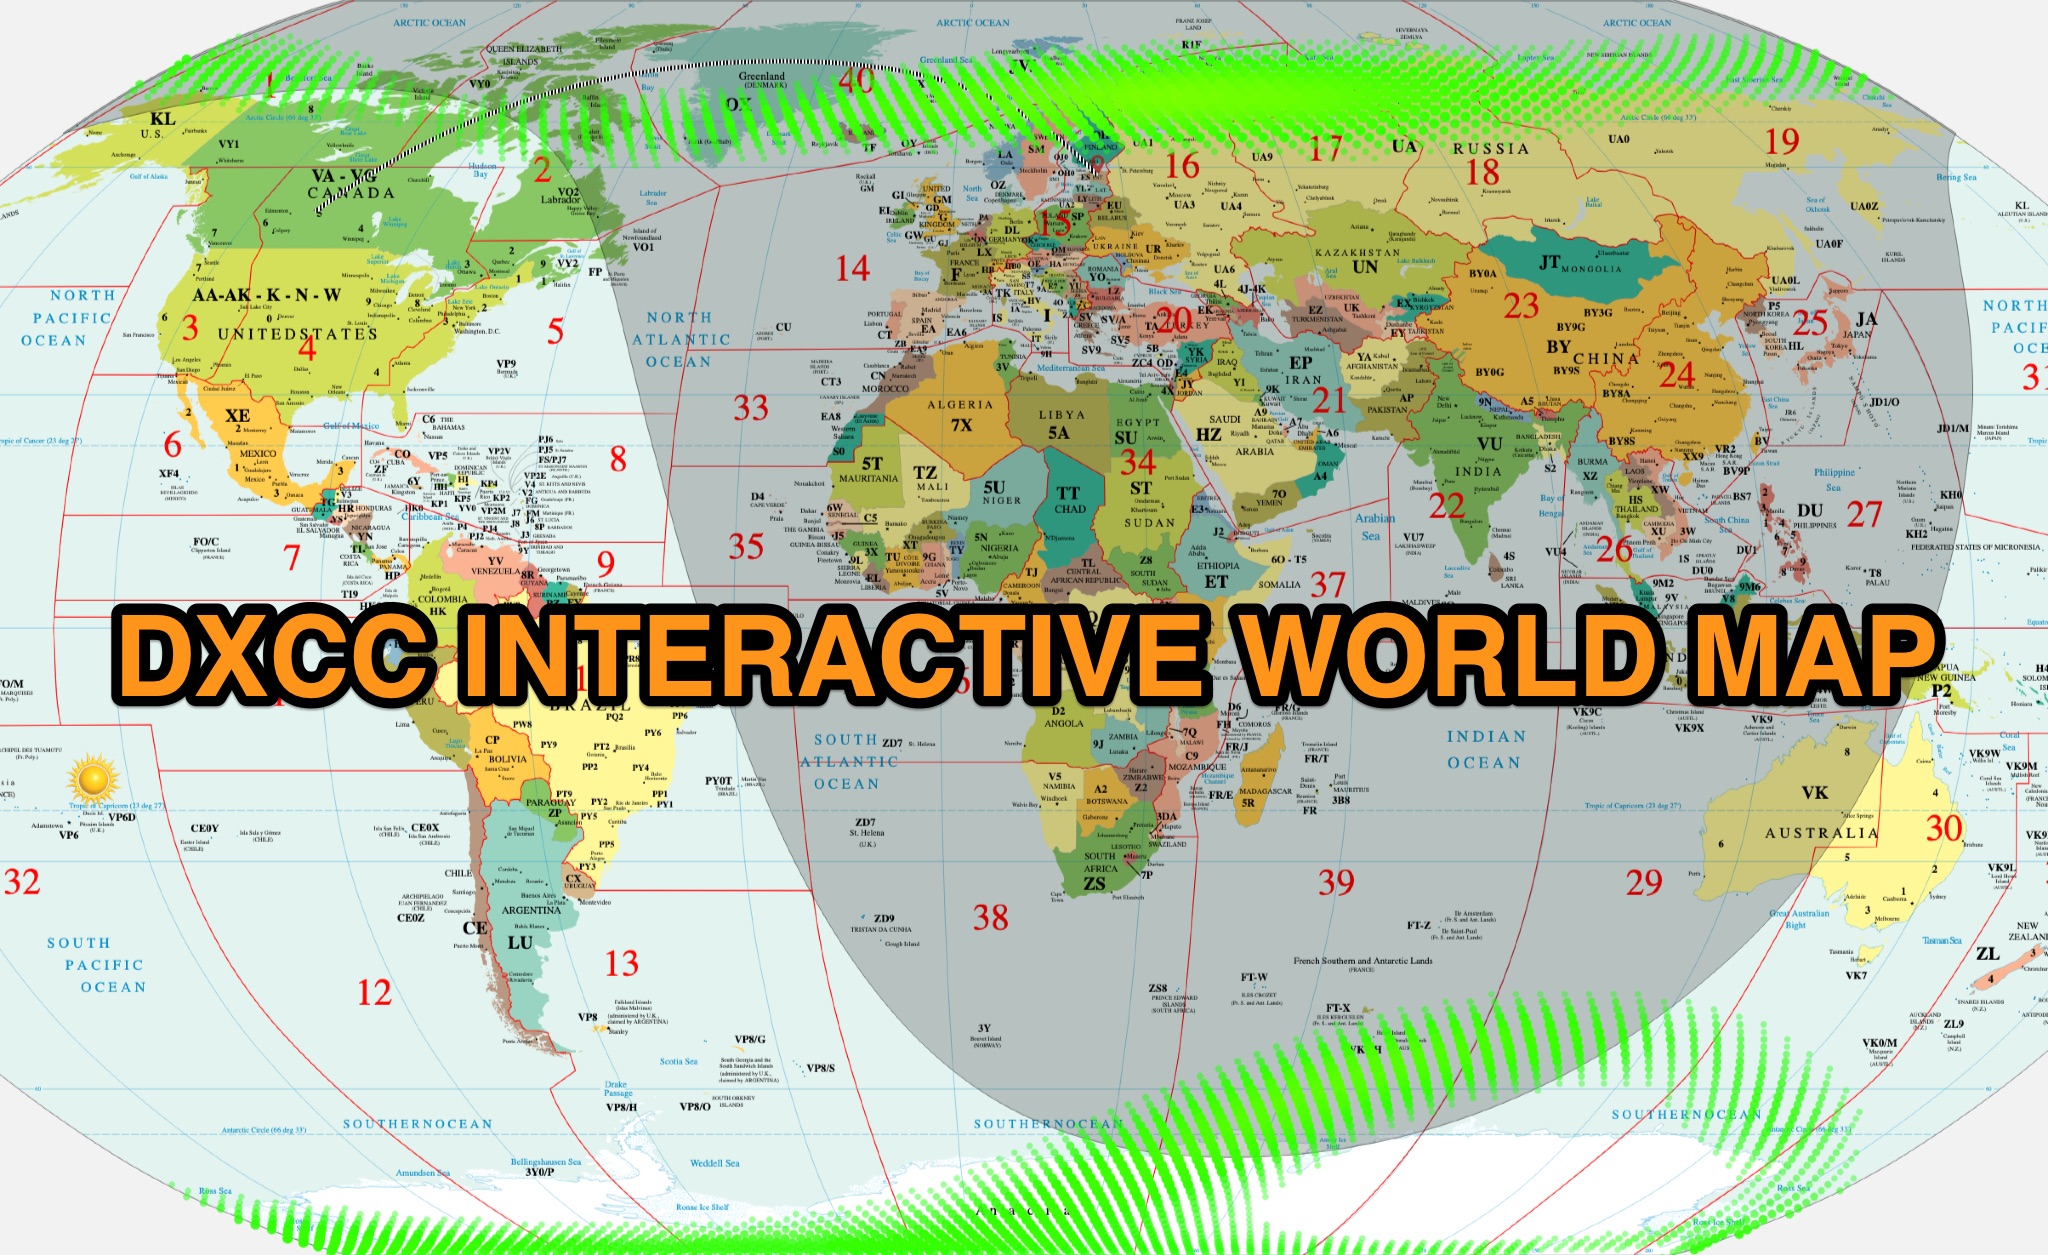
Key resources include HA8TKS DXCluster and RBN azimuthal maps for real-time spot visualization, and DXMaps.com for comprehensive cluster data across all bands. Tools like GridMapper WG7J and ADIF to KML converters facilitate plotting worked grids and QSOs from ADIF files onto Google Maps or Google Earth. Additionally, specialized maps like the DXCC Interactive World Map and CQ Zones MAP provide essential reference for award tracking and understanding global amateur radio divisions. Some services, such as QSOMap.org, integrate with QRZ.com for enhanced logging and mapping capabilities.
-
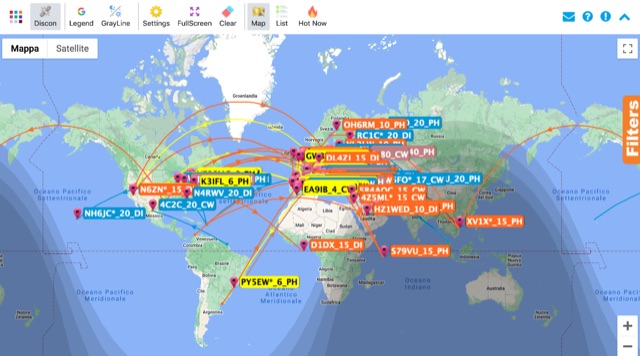 Online world map with live updates from the DX Cluster network, displaying new spots on the maps as they appear. Filtering options are available including bands, source continent and dx continent.
 -
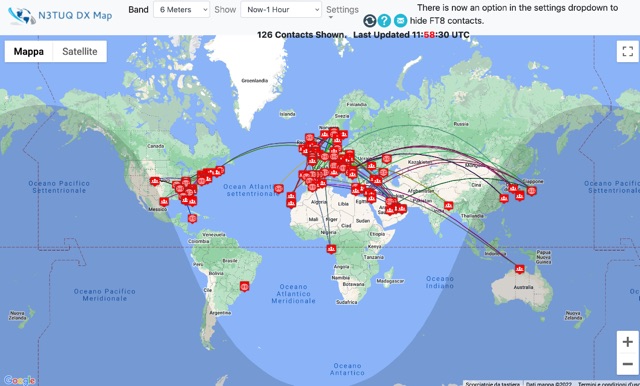
 6 Meter DX Map with reports from the VE7CC DX Cluster
 -
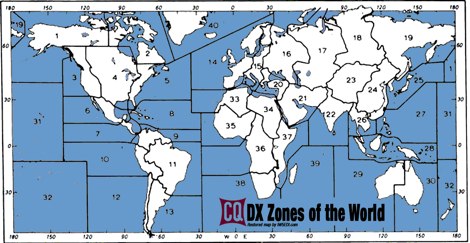 A restored version of the original CQ DX Zones of the world
 -
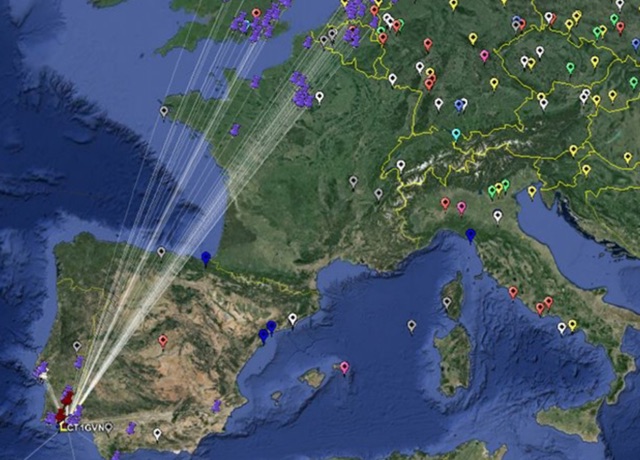
 This is a Live DX Cluster map powered by google maps diplays a map of ham radio QSOs or contacts based on qra locator and dx-cluster spots information
 -
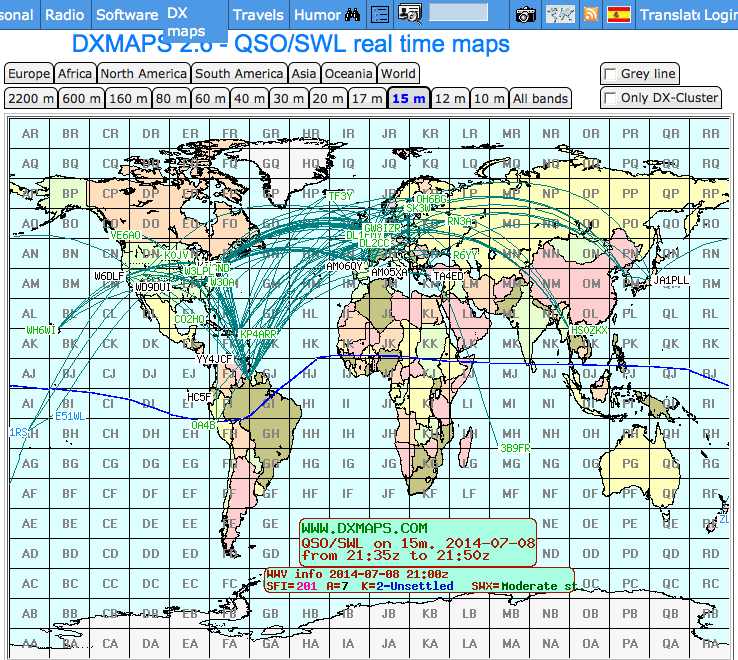 Shows QSO and SWL in real time, taking data from many different sources (DX-Cluster, WSPR, Reverse Beacon). It also allows to send DX-Spots and more features.
 -
 The DXCC World Map web application is a modern and interactive mapping tool designed for shortwave radio enthusiasts. It showcases a high-quality world map along with the Sun's position, sunrise and sunset times, the terminator, coordinates, QTH locator, azimuth, azimuth map, current DXCC list, Aurora, and WWV Geophysical Alert Messages. Additionally, it provides the SFI, X-Ray, Kp, and Ap indices.
 -
 DX Cluster spots mapped in real time for all bands.
 -
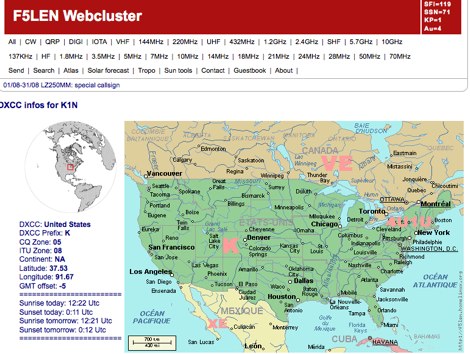 Search for call sign and display maps and dxcc info
 -
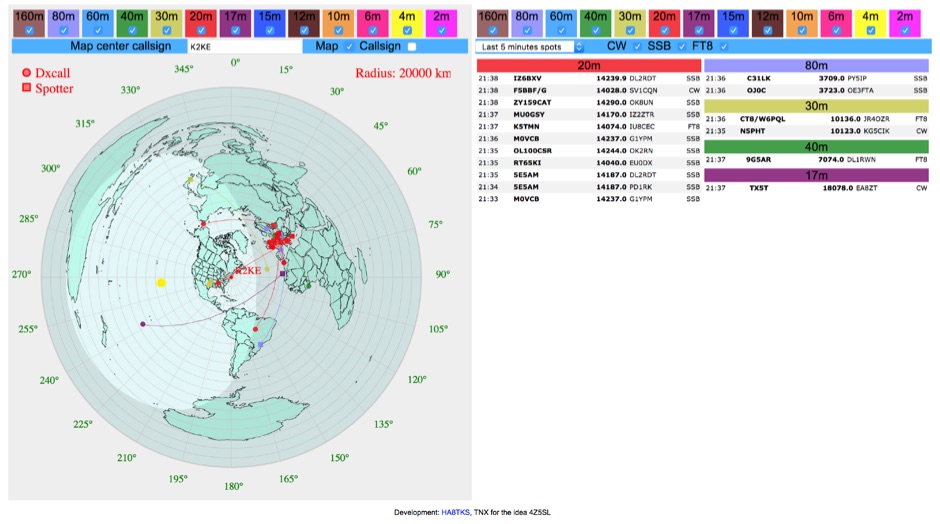 DXCluster spots rendered on a Real-Time Azimuthmal Map centered on a custom callsign
 -
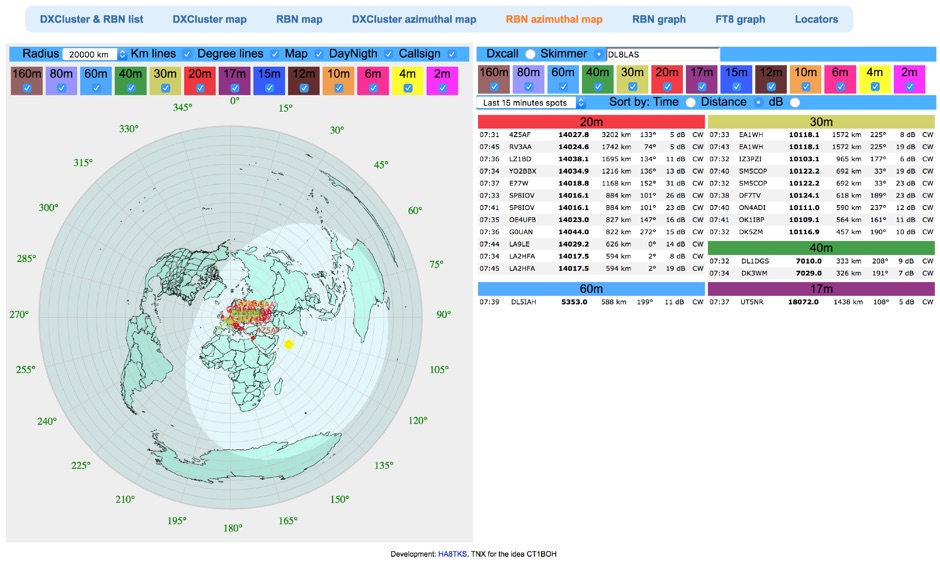 Reverse Beacon Network (RBN) remdered in a Real-Time Azimuthmal Map centered on a custom call sign
 -
 10 meter dx map
 -
 QSO Map Deactivated Due to a new pricing structure for Google Maps APIs (since March 1, 2025), the map function is no longer free to use. For this reason, the QSO Map has been deactivated.
 -
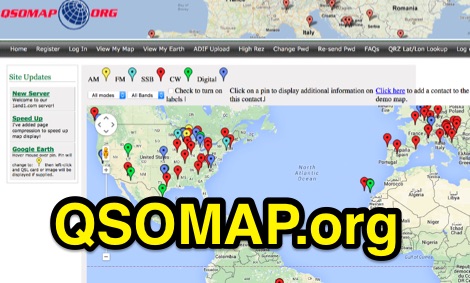 A web site offering a QRZ.com integrated mapping service. Allows creating a google map of your QSOs adding a list of QSOs manually or importing an ADIF log file. Registration and a QRZ.com account is required.
 -
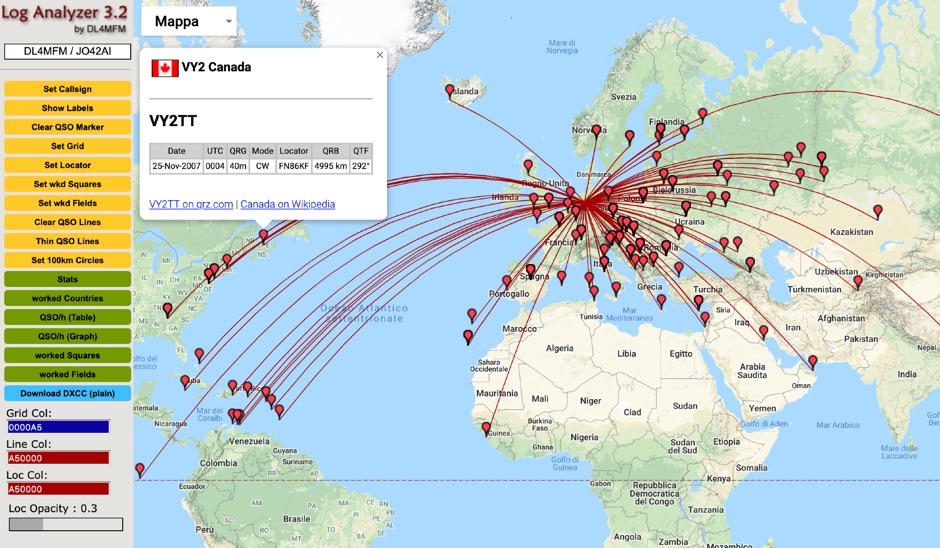
 This freeware application for Linux and windows, allows you to convert an ADIF file to a KML file so you can map your QSOs easily and open it with google maps, or google earth or any application supporting the KML format
 -
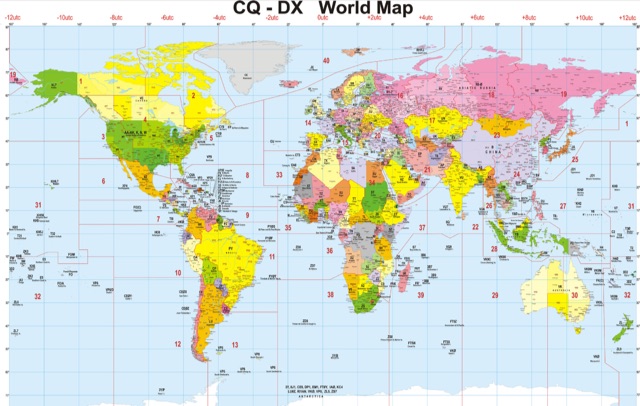 A large CQ Zones World Map in Jpeg format.
 -
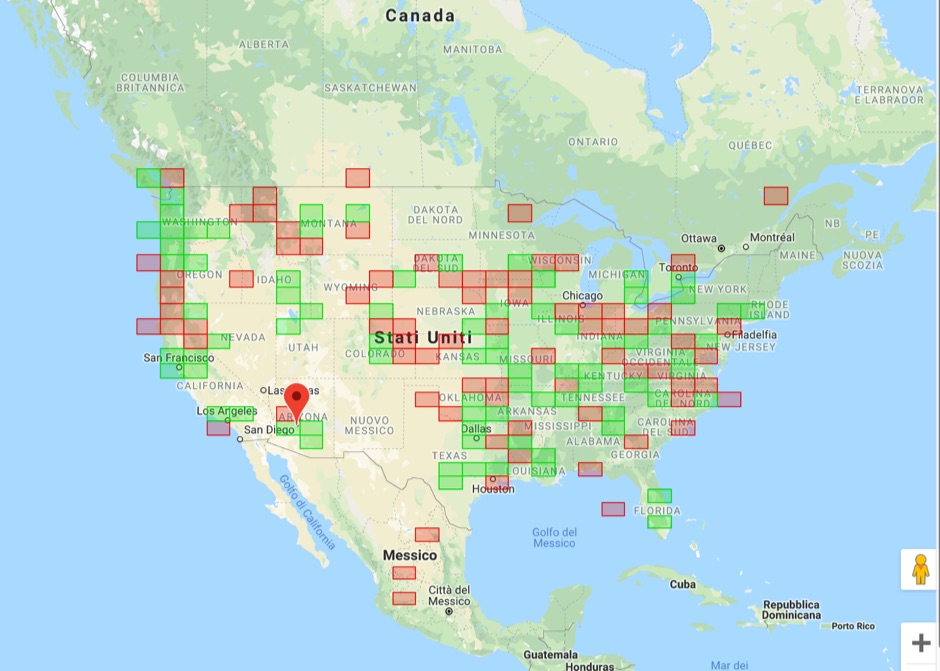 Upload an ADIF fiel and plot all worked grids in an online map. Support filtering by band, year and can export the output directly into a google map, or a google earth KML file
 -
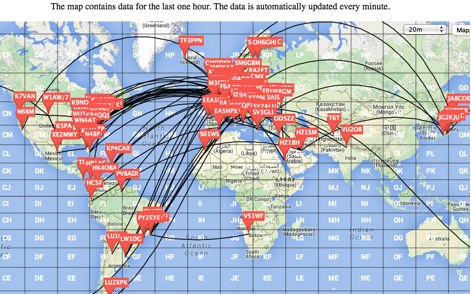
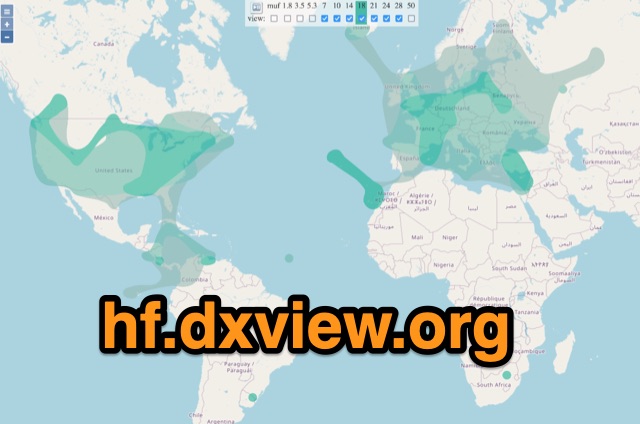 This map shows real-time radio propagation from stations operating on 11 bands between 1.8 and 54 MHz in the amateur radio service. The display shows world-wide activity from the last 15 minutes and is automatically updated about every minute. Data for the map is gathered from several online sources: WSPRnet, Reverse Beacon Network (CW, FT4, FT8), PskReporter, and DX Cluster.
 -
 DX Cluster spots represented in a google map, for 10m 6m 2m bands taken from the VE7CC DX Cluster. Some filtering options are available.