Zplots - Impedance Plots with MS Excel Charts
AC6LA
Rate this
323 Hits
Description
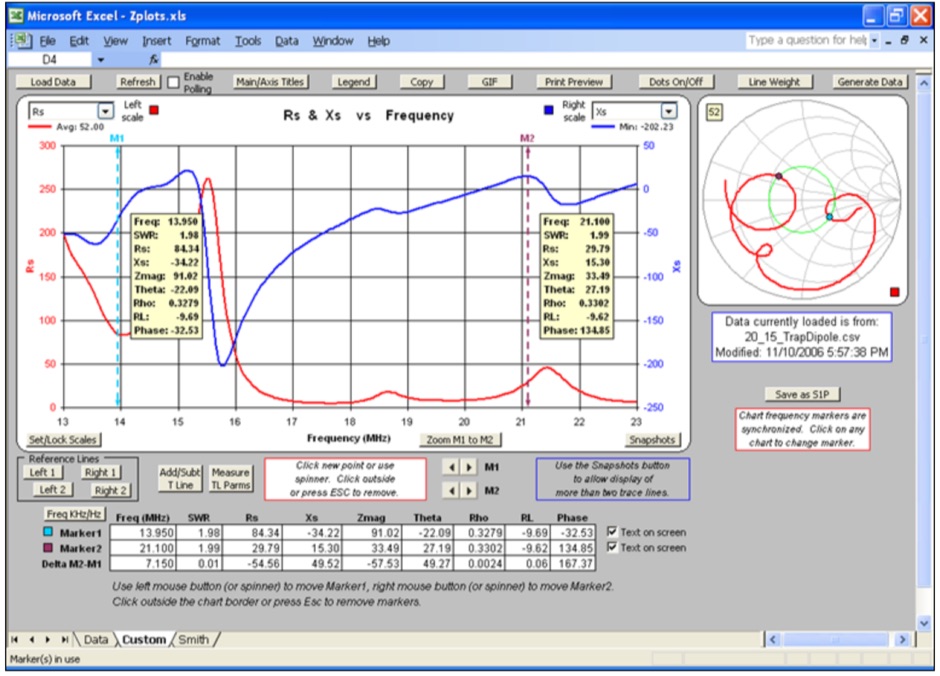
Zplots is an Excel application that allows you to plot impedance and related data obtained from a variety of sources. You can plot on both an XY chart and a Smith chart as well as view the data in tabular format.
The XY chart can be customized with your choice of trace lines. Frequency (in MHz) is always shown on the X axis.
Visit Resource
Opens in a new window
Ratings & Reviews
Share Your Opinion
No reviews yet. Be the first!