Search results
Query: WSPR spots
Links: 6 | Categories: 0
-
 Shows QSO and SWL in real time, taking data from many different sources (DX-Cluster, WSPR, Reverse Beacon). It also allows to send DX-Spots and more features.
 -
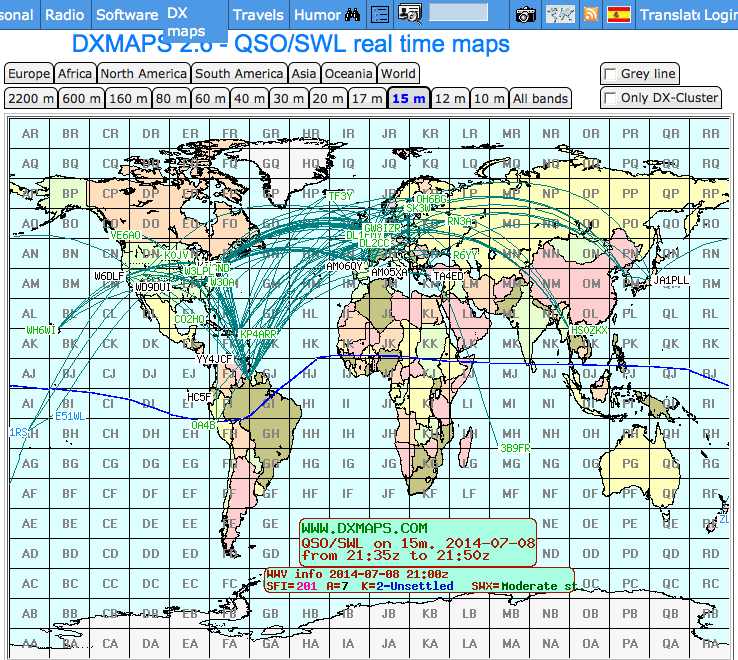
 DXMaps.com presents a dynamic, real-time mapping service for amateur radio DX spots, integrating data from traditional DX clusters, _PSK Reporter_, and WSPR networks. The platform visually plots global QSO and SWL activity, enabling users to observe propagation conditions across various bands, from 2200m to >450 MHz. It offers distinct overlays such as the magnetic equator, gray line, moon footprint for EME, and VOACAP propagation predictions, providing a comprehensive view of radio wave behavior. The service allows granular filtering of displayed spots, including options to show only DX-Cluster data, PSK Reporter activity, or WSPR signals. Users can refine the map view by selecting specific bands (e.g., 160m, 20m, 6m, 2m), limiting spots to the last 15 minutes, or displaying only contacts exceeding **2600 km**. Additional features include the ability to toggle grid squares, aurora forecasts, and various amateur radio zones (CQ, ITU). Distinctively, the resource updates automatically every minute, ensuring current propagation intelligence without manual refresh. It also supports specialized views for EME, ionospheric scatter, and aircraft scatter, alongside FM DX and APRS activity. The platform emphasizes the importance of accurate locator information in DX spots to enhance data quality and offers a user manual and FAQ for guidance.
 -
 KB9AMG's Top WSPR Spots presents a focused online tool for monitoring **2-way WSPR reports**, specifically detailing propagation data from February 2026 through March 2026. This resource aggregates _WSPRnet_ data, allowing radio amateurs to observe weak signal propagation conditions across various bands. The interface is straightforward, presenting callsigns, frequencies, signal-to-noise ratios, and distances for each reported contact, which is crucial for understanding current band openings and signal paths. The utility of this WSPR spotter lies in its ability to quickly visualize global propagation. Users can identify active stations and assess signal viability over long distances, with reports often showing contacts spanning thousands of kilometers. For instance, a typical WSPR report might indicate a signal from Europe reaching North America with a _SNR_ of -25 dB, demonstrating effective low-power communication. This data is invaluable for planning DX operations or evaluating antenna performance under actual propagation conditions.
 -
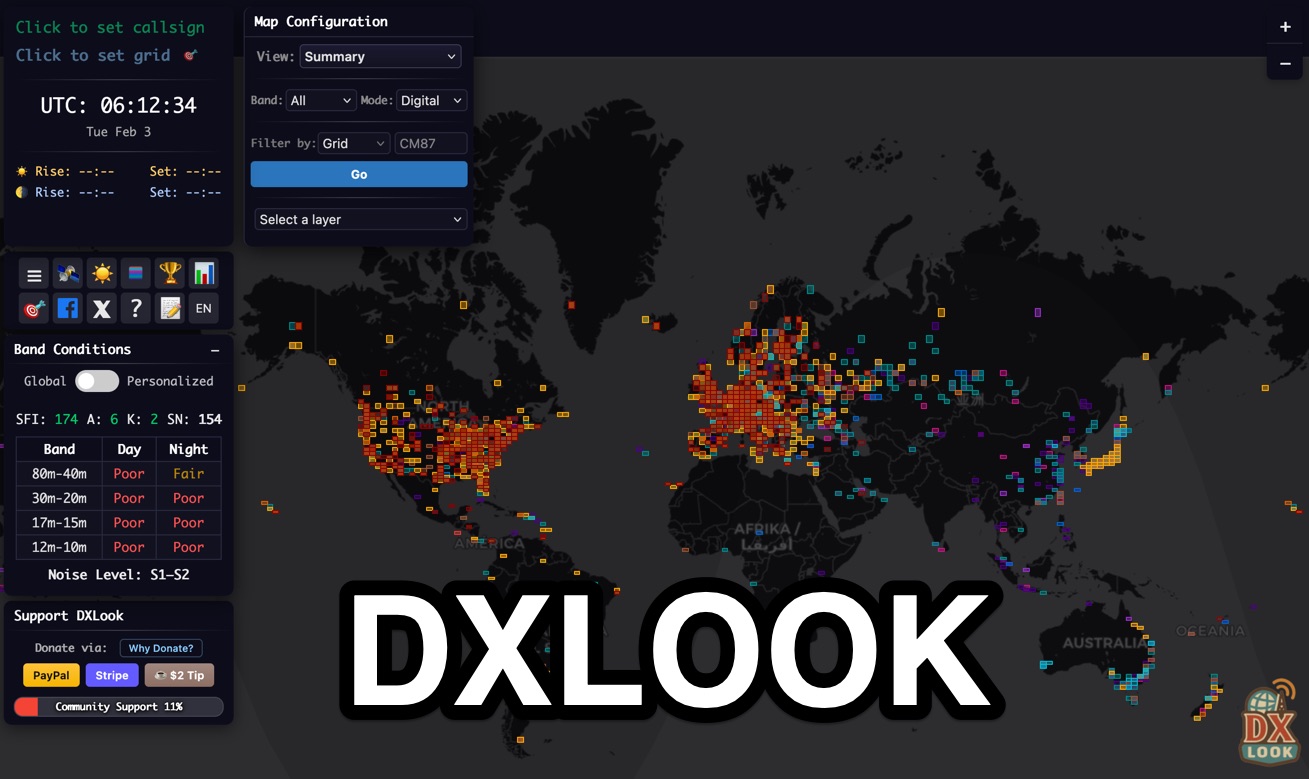 DXLook is a free, web-based propagation platform that delivers comprehensive, real-time insight into HF and VHF conditions directly from any modern browser. It aggregates live spots from PSK Reporter, WSPRnet, RBN, and DX Cluster, complemented by NOAA space-weather metrics such as SFI, K/A indices, and geomagnetic alerts. Integrated VOACAP predictions allow practical "theory versus reality" comparisons, while the interactive world map with filters, gray line, and grid overlays enhances situational awareness. With no installation or maintenance required, DXLook provides a convenient, accurate, and accessible solution for everyday operating and propagation analysis.
 -
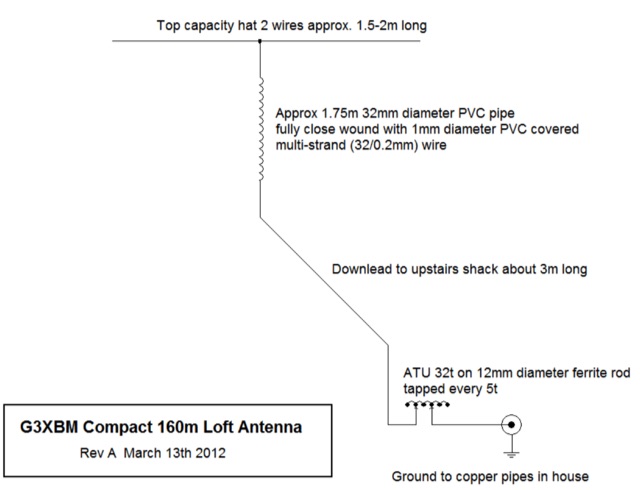 This is a very small vertical 160m antenna that fits in the loft of even my small house. It was built as a way of getting a signal out on 160m for local AM contacts, but the local noise level was far too high to allow it to be used at night for this purpose. However, on WSPR it did a pretty good job with WSPR spots from a very long way across Europe being received when running 2.5W out.
 -
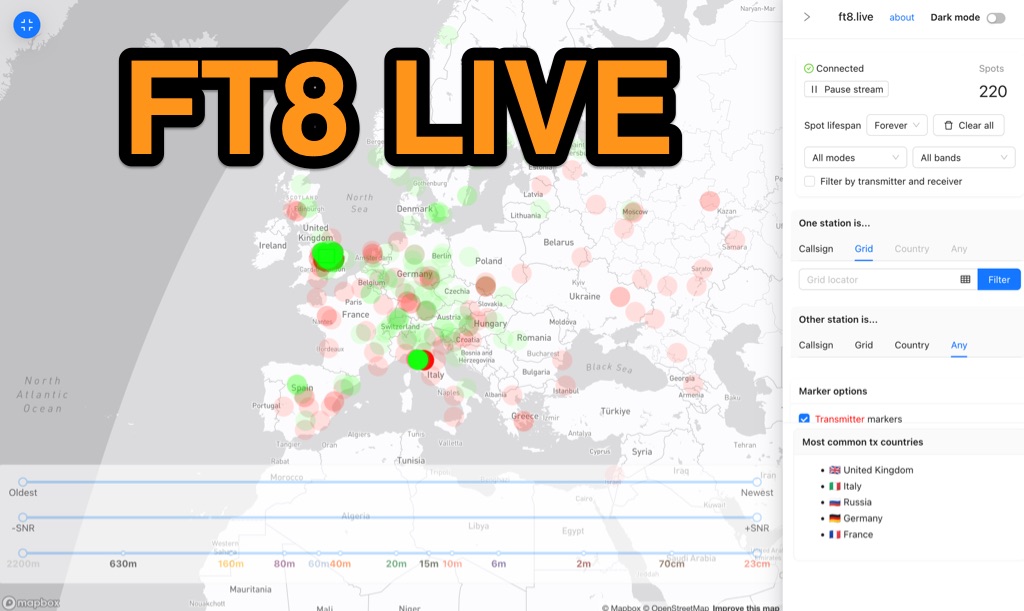 Visualizes real-time amateur radio propagation spots using data from the PSK Reporter MQTT stream, providing immediate situational awareness for radio operators. The platform displays spots from various modes, including CW, WSPR, and JT65, in addition to the dominant FT8 digital protocol. FT8 Live focuses exclusively on live data streams, prioritizing current signal activity over historical archiving, which differentiates it from the official PSK Reporter map. A key feature is its integration with the Summits on the Air (SOTA) API, facilitating SOTA chasing by cross-referencing transmitting callsigns with SOTA alerts; a station is identified as an activator if the spot correlates with a scheduled alert within an eight-hour window. The user interface was developed by Arron (ZL1AN), with core data from Philip Gladstone (N1DQ), and stream delivery managed by Tom Stanton (M0LTE).