Search results
Query: WSPRnet
Links: 6 | Categories: 0
-
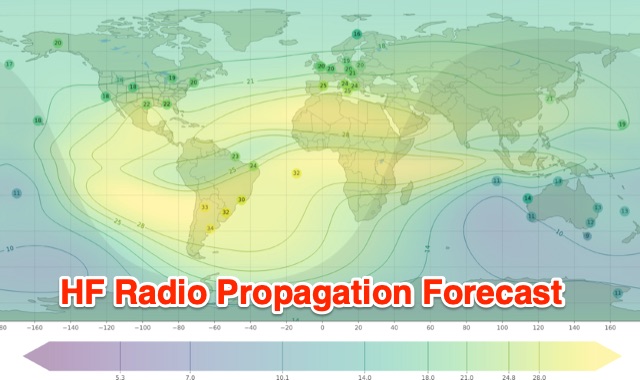 Understanding high-frequency (HF) skywave propagation is crucial for amateur radio operators seeking to optimize long-distance communications. This resource details the fundamental principles of HF radio propagation, including the properties of electromagnetic waves, the characteristics of various HF bands, and distinct propagation modes such as skywave, ground wave, and line-of-sight. It places significant emphasis on the ionosphere's pivotal role in refracting HF waves, explaining how solar activity directly influences ionospheric conditions and, consequently, propagation paths. The resource integrates real-time monitoring capabilities, featuring dynamic charts and data from DX clusters, WSPRnet, and the Reverse Beacon Network, which allow users to track current band activity and propagation conditions globally. It also delves into advanced topics like Near Vertical Incidence Skywave (NVIS) and gray line propagation, providing insights into ionosonde data and various propagation prediction models. The site presents a detailed analysis of solar-terrestrial interactions, geomagnetic indices, and space weather phenomena, illustrating their direct impact on HF communication reliability. Practical tools and applications are highlighted, including real-time QSO planners, online Maximum Usable Frequency (MUF) maps, and alerts for solar flares or geomagnetic storms. The guide systematically breaks down complex concepts into accessible chapters, offering a structured approach to learning about ionospheric regions, diurnal and seasonal effects, and the interpretation of propagation indicators like foF2, MUF, and Lowest Usable Frequency (LUF). This makes it a robust reference for hams aiming to deepen their technical understanding and improve operational effectiveness.
 -
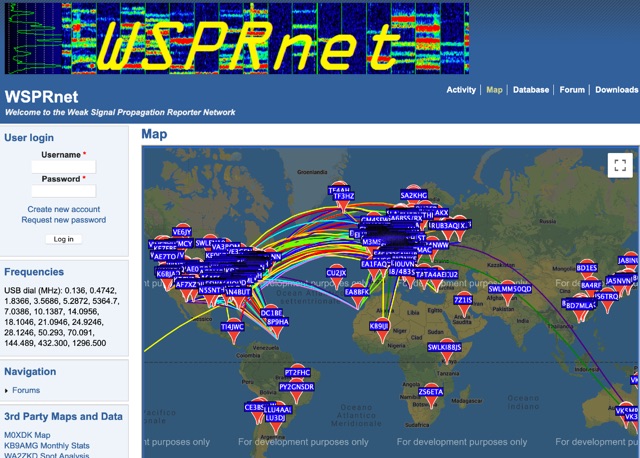 Weak Signal Propagation Reporter Network Map and Database of WSPR data
 -
 KB9AMG's Top WSPR Spots presents a focused online tool for monitoring **2-way WSPR reports**, specifically detailing propagation data from February 2026 through March 2026. This resource aggregates _WSPRnet_ data, allowing radio amateurs to observe weak signal propagation conditions across various bands. The interface is straightforward, presenting callsigns, frequencies, signal-to-noise ratios, and distances for each reported contact, which is crucial for understanding current band openings and signal paths. The utility of this WSPR spotter lies in its ability to quickly visualize global propagation. Users can identify active stations and assess signal viability over long distances, with reports often showing contacts spanning thousands of kilometers. For instance, a typical WSPR report might indicate a signal from Europe reaching North America with a _SNR_ of -25 dB, demonstrating effective low-power communication. This data is invaluable for planning DX operations or evaluating antenna performance under actual propagation conditions.
 -
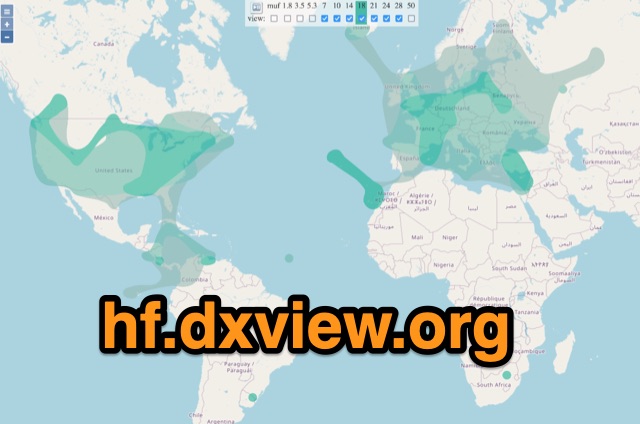 This map shows real-time radio propagation from stations operating on 11 bands between 1.8 and 54 MHz in the amateur radio service. The display shows world-wide activity from the last 15 minutes and is automatically updated about every minute. Data for the map is gathered from several online sources: WSPRnet, Reverse Beacon Network (CW, FT4, FT8), PskReporter, and DX Cluster.
 -
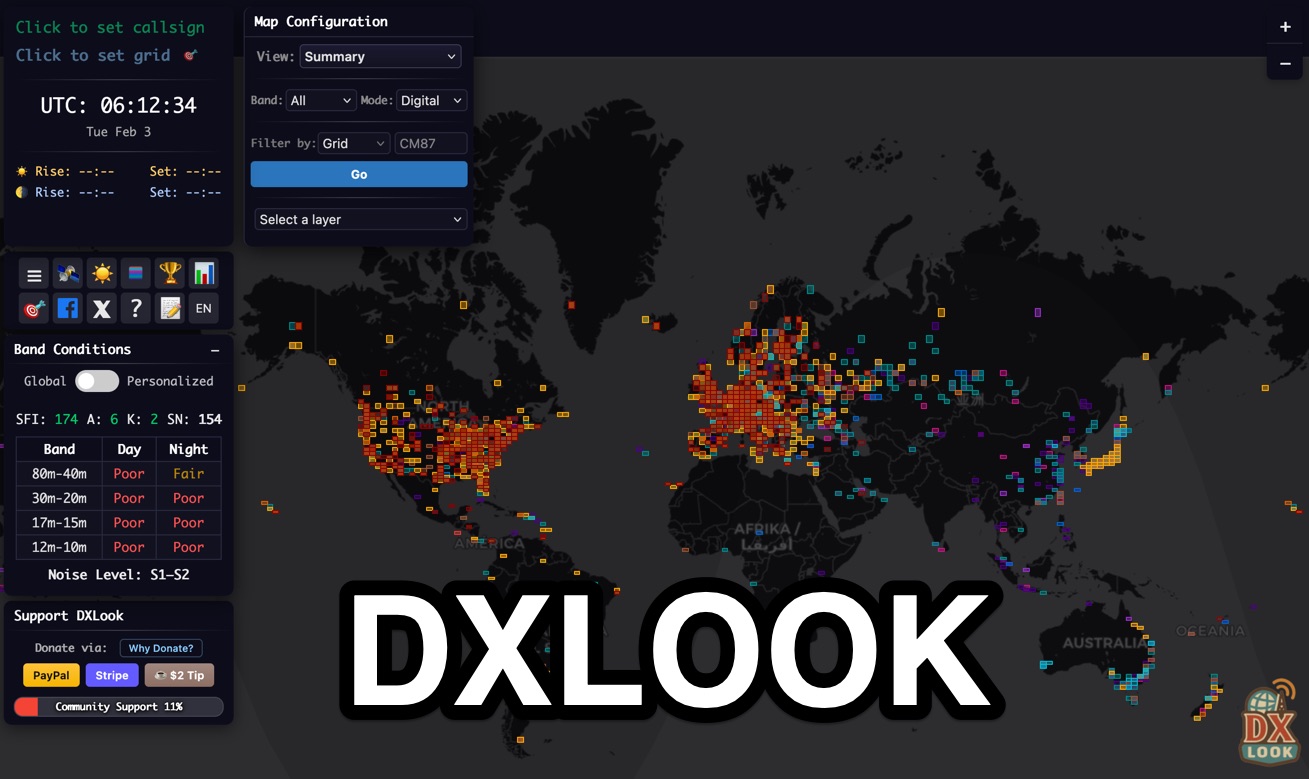 DXLook is a free, web-based propagation platform that delivers comprehensive, real-time insight into HF and VHF conditions directly from any modern browser. It aggregates live spots from PSK Reporter, WSPRnet, RBN, and DX Cluster, complemented by NOAA space-weather metrics such as SFI, K/A indices, and geomagnetic alerts. Integrated VOACAP predictions allow practical "theory versus reality" comparisons, while the interactive world map with filters, gray line, and grid overlays enhances situational awareness. With no installation or maintenance required, DXLook provides a convenient, accurate, and accessible solution for everyday operating and propagation analysis.
 -
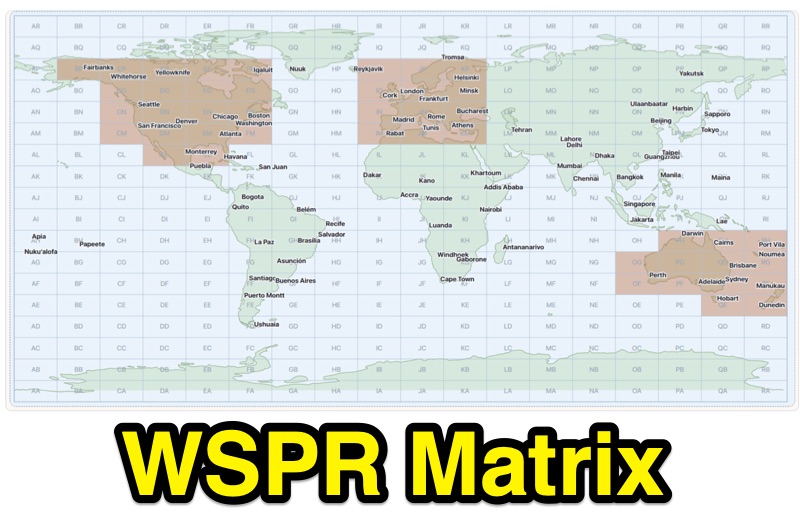 Demonstrates WSPR propagation activity, presenting observed data by reporter, band, UTC time, local time, and user-selected global destination areas. The application allows users to analyze WSPR spots from a live data server or import saved WSPRnet query files, bypassing the 10,000-row download limit by collecting individual band files for busy bands. Users can configure band preferences and destination modes, choosing between city radius or Maidenhead map grids for filtering path destinations. The interface provides options to start current-day live collection, a 7-day continuous archive, or load previously saved data to build the propagation matrix. Diagnostic information and archive history are accessible, alongside map setup controls for grid contrast and visibility. The tool supports both Path 1 and Path 2 map destinations, enabling detailed analysis of WSPR signal paths.