Search results
Query: overlay
Links: 13 | Categories: 0
-
 DXMaps.com presents a dynamic, real-time mapping service for amateur radio DX spots, integrating data from traditional DX clusters, _PSK Reporter_, and WSPR networks. The platform visually plots global QSO and SWL activity, enabling users to observe propagation conditions across various bands, from 2200m to >450 MHz. It offers distinct overlays such as the magnetic equator, gray line, moon footprint for EME, and VOACAP propagation predictions, providing a comprehensive view of radio wave behavior. The service allows granular filtering of displayed spots, including options to show only DX-Cluster data, PSK Reporter activity, or WSPR signals. Users can refine the map view by selecting specific bands (e.g., 160m, 20m, 6m, 2m), limiting spots to the last 15 minutes, or displaying only contacts exceeding **2600 km**. Additional features include the ability to toggle grid squares, aurora forecasts, and various amateur radio zones (CQ, ITU). Distinctively, the resource updates automatically every minute, ensuring current propagation intelligence without manual refresh. It also supports specialized views for EME, ionospheric scatter, and aircraft scatter, alongside FM DX and APRS activity. The platform emphasizes the importance of accurate locator information in DX spots to enhance data quality and offers a user manual and FAQ for guidance.
 -
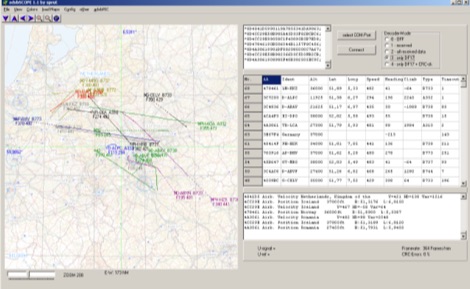 adsbScope is a freeware Windows application designed for processing _ADS-B_ (Automatic Dependent Surveillance-Broadcast) frames received from a compatible decoder. It identifies aircraft, calculates their real-time positions, and presents flight parameters in both alphanumeric tables and a graphical display. The software interfaces via a virtual COM port, receiving raw frames to provide detailed situational awareness, including a global coordinate grid, continental coastlines, over 4,000 **airport** locations, and major cities. Users can overlay OpenStreetMap tiles and view world state boundaries, with each tracked aircraft rendered with labels showing altitude, speed, heading, squawk code, and flight identifiers. When paired with the adsbPIC-decoder, adsbScope enables advanced hardware control, allowing users to toggle data filters for specific frames like DF17/18/19, adjust analog signal thresholds for reception fine-tuning, and manage system resets or bootloader activation directly from the PC. This functionality provides a customizable toolkit for hobbyist radar listeners, offering a robust alternative to commercial tools for processing aircraft data. The software displays up to **1090 MHz** transponder data and can track aircraft up to 250 nautical miles.
 -
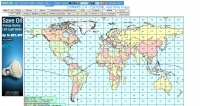
 Dynamic Map Progam with 34 maps, 442 overlays, and realtime position/locator info. Online Demo available. 0-59c per map.
 -
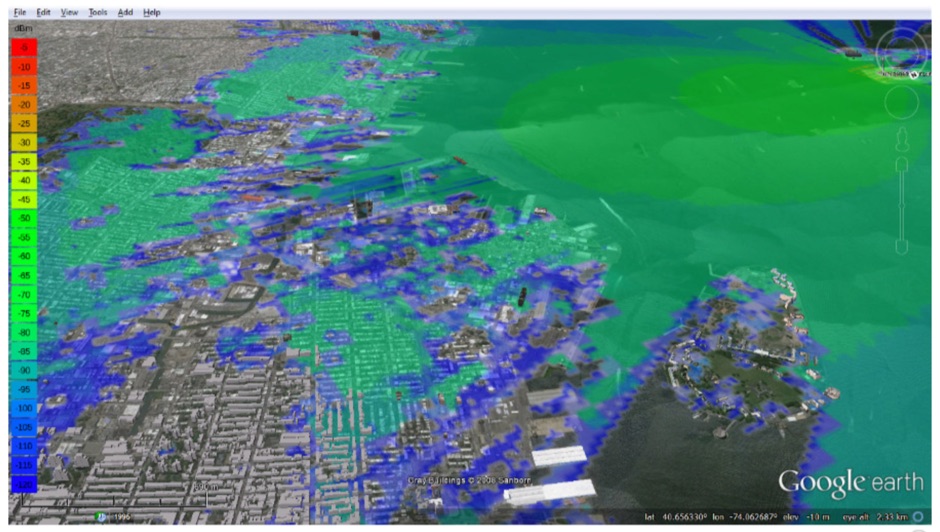 The ultimate Keyhole Markup Language (KML) plugin for Google earth. Keyhole Radio is a unique and powerful RF planning interface, accessed by loading a Keyhole Markup Language (KML) overlay in Google earth.
 -
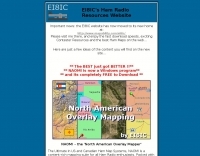 Over 47 full-screen maps are available within _NAOMI_ (North American Overlay Mapper), a free Windows program designed for US and Canadian amateur radio enthusiasts. This mapping suite includes 9 backgrounds such as CQ Zones, ITU Zones, and ARRL Sections, along with 16 foreground layers like Counties, Areacodes, and Grid Locators. Users can calculate distances and bearings, track real-time mouse positions with continuous Grid-Locator data, and integrate with APRS for live station tracking via the FindU database. For a global perspective, the _Global Overlay Mapper_ (GOM) provides a world map, 8 continental maps, and 29 sub-continental maps, all with 12 active layers including Country Outlines, CQ/ITU Zones, and Prefix information. Both NAOMI and GOM offer feature-locate systems to jump to positions based on prefixes, capital cities, or Grid Locators, and provide customized beam headings and distance displays. The site also features _LogView_, a post-contest log visualization tool that analyzes Cabrillo-format logs by plotting QSOs on maps, supporting over 30 major contests like CQWW and ARRL DX, and allowing comparison with published results.
 -
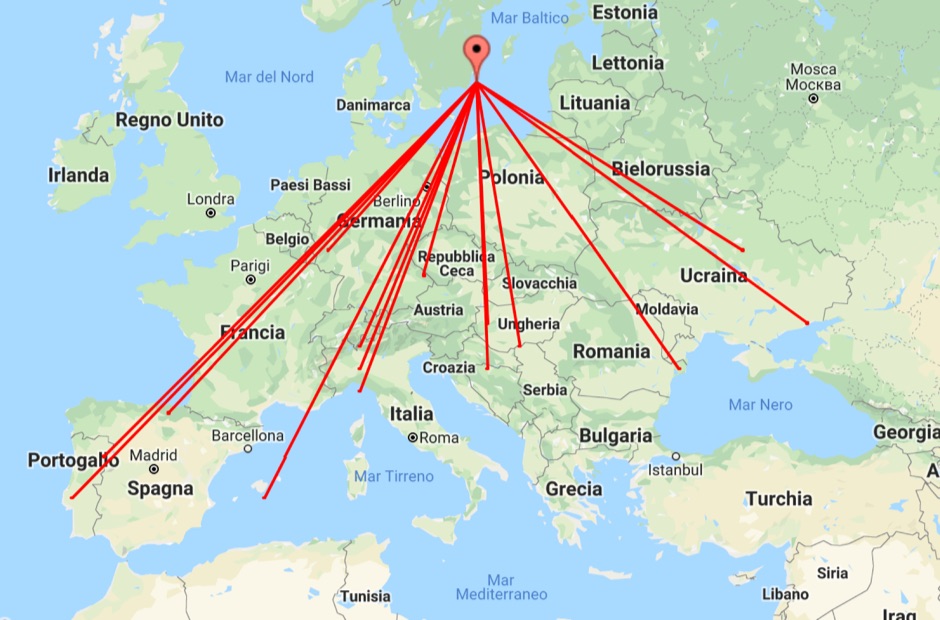 With this tool it is possible to create QSO maps overlay on Google maps there each QSO get a line from the home location to each DX location. An EDI logbook file is used as input. The creation will only use complete locator in the 6 characters format.
 -
 Several HD video overlay devices are offered, including the GeoStamp HD, which overlays GPS latitude, longitude, heading, speed, altitude, date, time, and depth onto AHD, HD-TVI, and HD-CVI (720p/1080p) video sources. The VideoStamp HD allows user-defined text overlays on similar HD video inputs, while the VideoStamp Keyboard HD enables text input via a PS/2 keyboard for video overlay. For commercial applications, the PostMark HD integrates with cash registers and POS terminals to overlay transaction data onto security camera feeds. Beyond HD video solutions, the DTMF-8 DTMF Decoder provides remote control capabilities for up to eight devices or relays using touch tones from a radio or other audio source. This decoder supports four operational modes and includes password protection, storing all settings in non-volatile EEPROM memory. The product line also includes standard definition OSD, RS-232, GPS, and POS text inserters, along with various DTMF encoders and DVR solutions.
 -
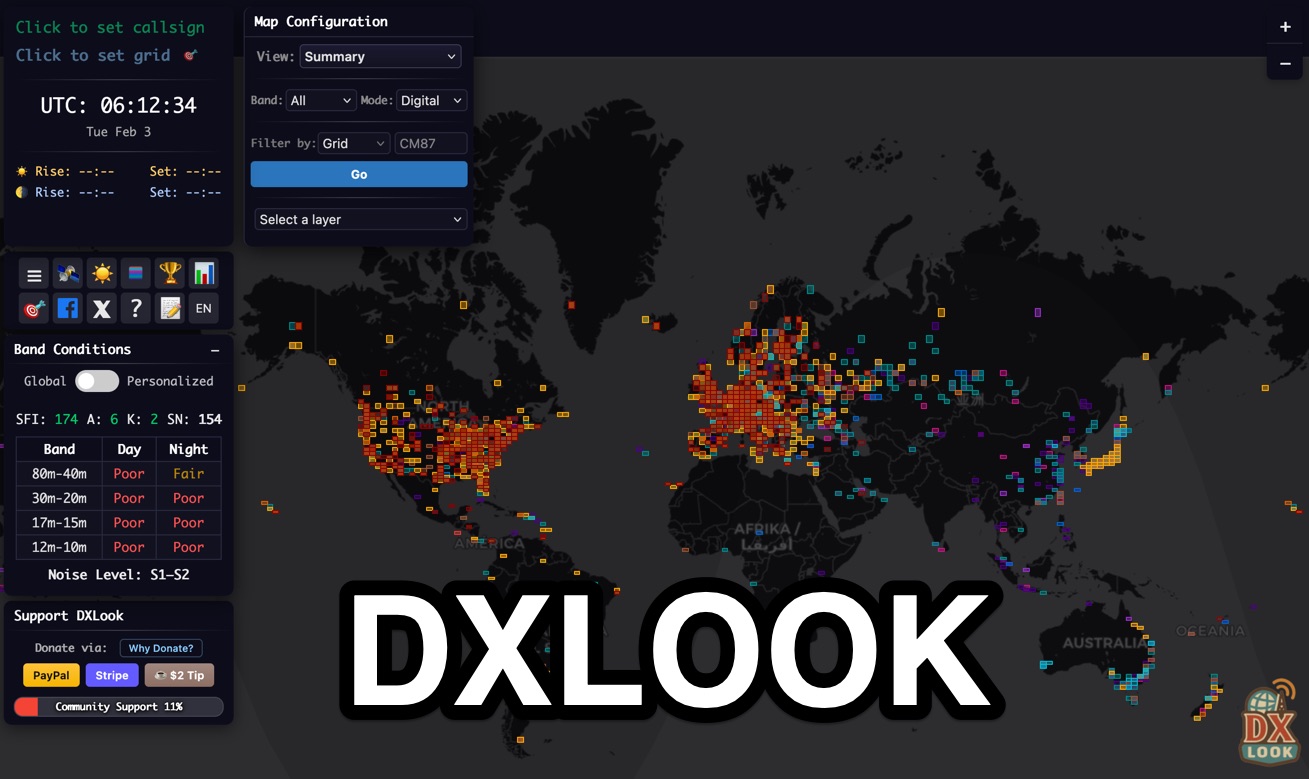 DXLook is a free, web-based propagation platform that delivers comprehensive, real-time insight into HF and VHF conditions directly from any modern browser. It aggregates live spots from PSK Reporter, WSPRnet, RBN, and DX Cluster, complemented by NOAA space-weather metrics such as SFI, K/A indices, and geomagnetic alerts. Integrated VOACAP predictions allow practical "theory versus reality" comparisons, while the interactive world map with filters, gray line, and grid overlays enhances situational awareness. With no installation or maintenance required, DXLook provides a convenient, accurate, and accessible solution for everyday operating and propagation analysis.
 -
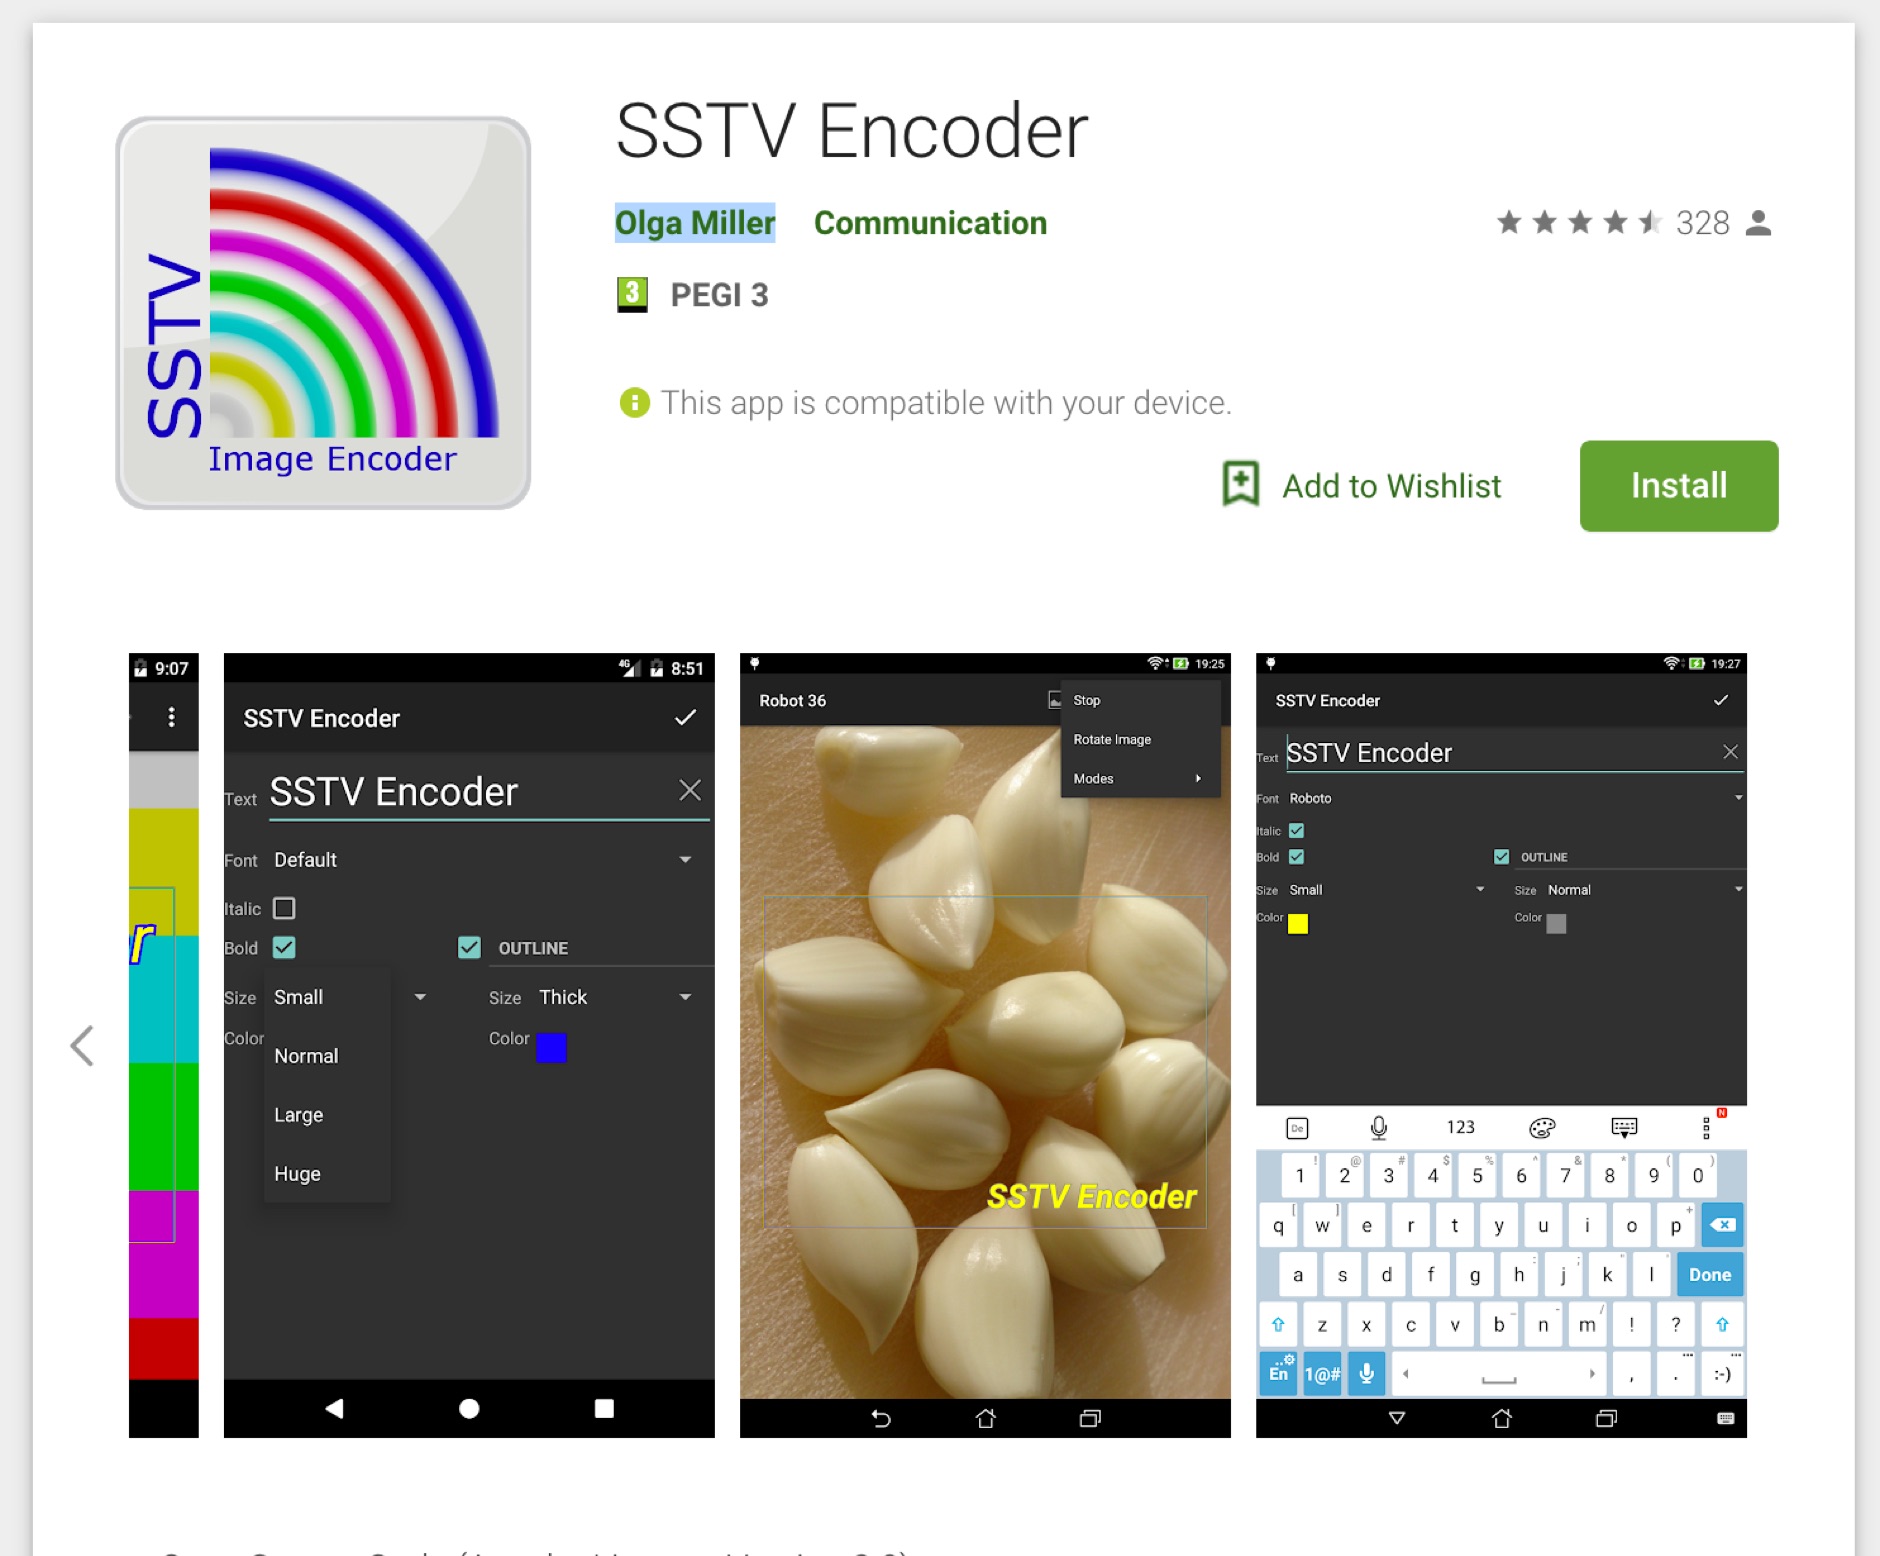 This free app encode pictures in Slow Scan TV SSTV signals. Support the most popular modes Martin 1, Martin 2, Scottie Modes, Robot and Wraase modes. Image editing is even possible with som text overlaying features
 -
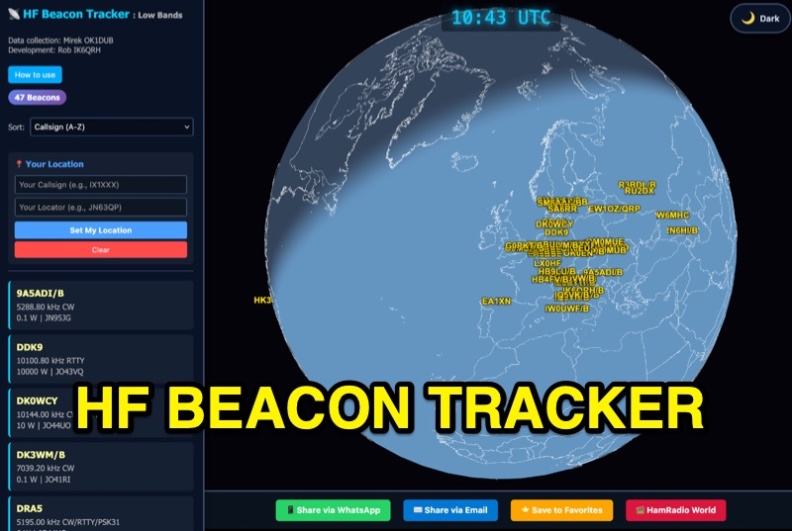 The HF Beacon Tracker is an advanced interactive tool designed for DXers and ham radio opoerators in general to monitor active beacons operating below 14 MHz. Built upon a high-fidelity 3D Earth globe, the application provides a spatial perspective on signal paths by integrating real-time environmental data with a comprehensive beacon database curated by Mirek OK1DUB. Beacons are plotted using precise Maidenhead locators and feature a real-time day/night terminator overlay to help operators identify Gray Line propagation opportunities. With a single click, users can calculate the exact distance from their own QTH to any beacon, visualized via an animated Great-Circle Path arc on the globe surface. To enhance its diagnostic capabilities, the tool seamlessly integrates with PSK Reporter, allowing users to right-click CW beacons to instantly fetch current reception reports and signal strength data. The interface is fully optimized with a mobile-responsive design, smooth globe rotation, and togglable Dark/Light themes suitable for any shack environment. Whether you are performing antenna gain tests, conducting ionospheric research, or simply hunting for band openings, the HF Beacon Tracker transforms raw database information into an intuitive, visual diagnostic suite. It serves as an essential asset for any operator looking to master HF band conditions.
 -
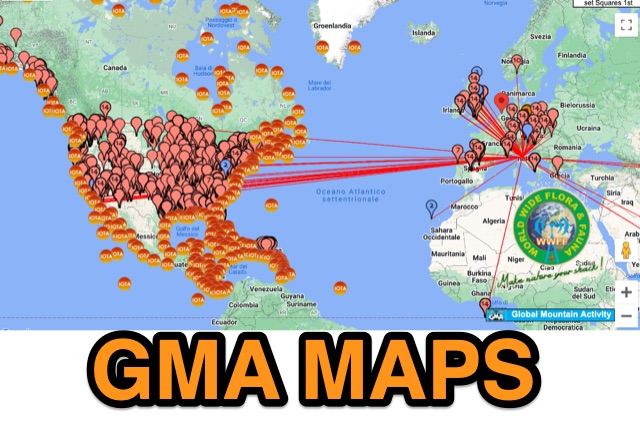 GMA provides an on-line google-map based map with overlays for sota, iota, wwff, lighthouse, mills
 -
 Spotty leverages Philip Gladstone’s pskreporter.info data, delivered via an MQTT broker by Tom Fanning (M0LTE), to offer a responsive web application for visualizing propagation. The Map View presents a default visualization (grid AA00 / callsign MY8CALL) and distinguishes signal types: small spots for signals heard by a location, large spots for transmissions from a location, and teardrop markers for transmissions from the monitored callsign. Clicking a spot reveals detailed signal data in an overlay. The application includes a Log View for raw spot data and a Settings tab for customization. Users can filter tracking by specific Callsign or Grid, with preferences saved to the browser. A notable feature is the Time to Live (TTL) setting, adjustable from the default 60 seconds, which controls spot visibility duration to manage map clutter during high-traffic periods. The tool provides a clear, logic-driven interface for real-time signal monitoring.
 -
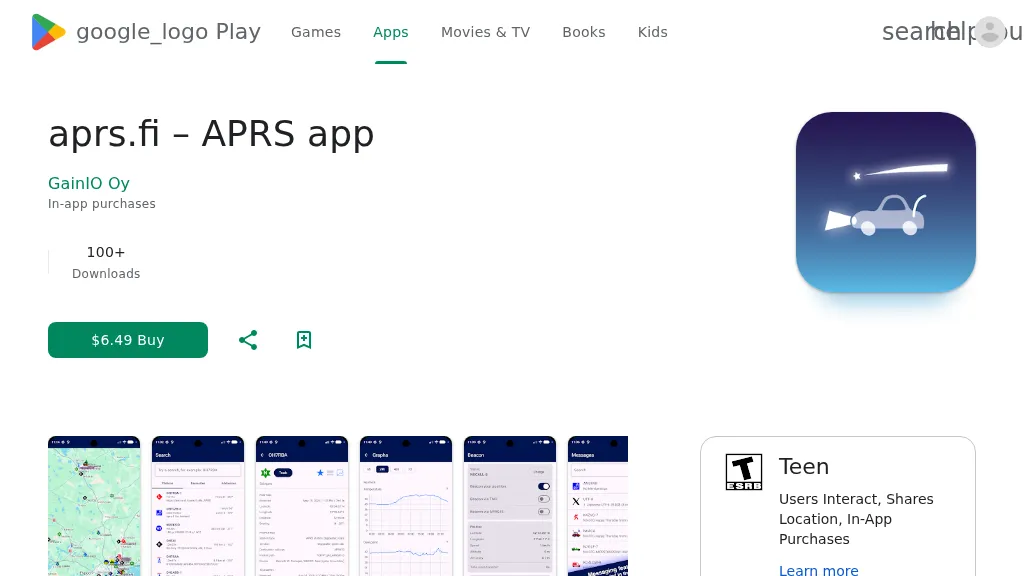 The aprs.fi Android application offers immediate, real-time access to APRS position information, weather reports, and telemetry graphs, allowing users to zoom and browse stations globally without delay. It includes features like callsign and address search with history, multi-station tracking, and map filtering for elements such as weather stations and AIS targets. The app also supports KML and GeoJSON overlay files for enhanced map visualization. Users can beacon their position directly to aprs.fi or connect wirelessly to a Bluetooth, BLE, WiFi, or USB-attached TNC for receiving and transmitting position beacons without an internet connection. The application runs on the robust and fast aprs.fi database, providing _Dark Mode_ support for improved ergonomics in low-light conditions and high-resolution graphics for modern displays, including the full APRS symbol set. While the core application is a one-time purchase, some advanced functionalities, such as APRS text messaging, a high-performance software DSP modem, and _APRS-IS_ beaconing with up to **10 callsign profiles**, require an additional "Extra Features" subscription. This subscription also unlocks RX iGate functionality and extended time ranges for map and graph views, expanding its utility for serious APRS operators.