Search results
Query: ham radio map
Links: 103 | Categories: 4
-
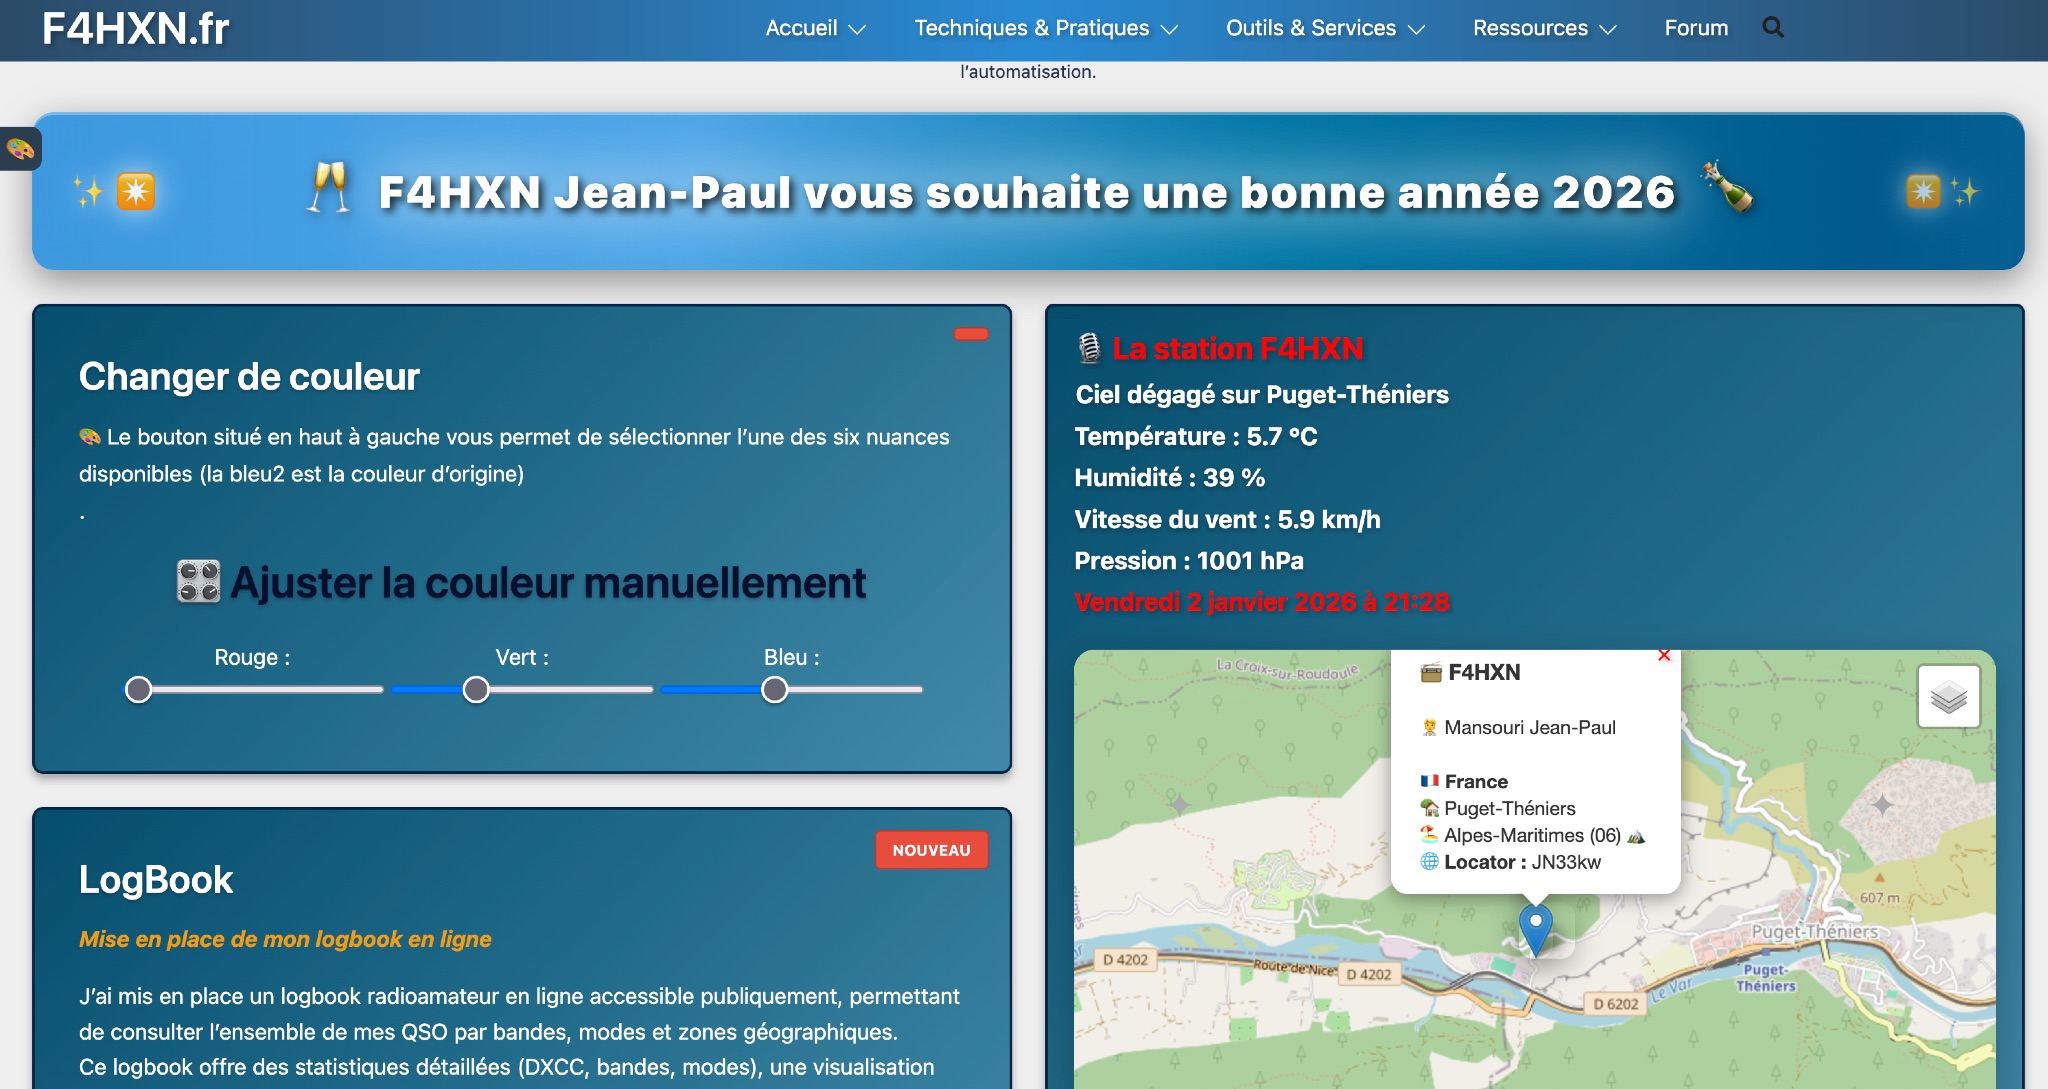 Demonstrates various technical projects and tutorials for amateur radio operators, focusing on digital modes, monitoring, and station setup. It covers topics such as implementing a _WSPR_ station, setting up ADS-B reception, configuring a _DXSpider_ cluster, and utilizing monitoring tools like Prometheus and Grafana. The resource provides practical guides for integrating modern IT solutions with ham radio activities, including Docker and Linux environments for radio applications. This site also features a publicly accessible online logbook, offering detailed statistics on QSOs by band, mode, and geographical zone, with visual mapping of contacts. It includes a comprehensive amateur radio lexicon, explaining hundreds of terms, and provides a real-time display of the F4HXN station's local weather conditions. The resource also aggregates information on upcoming ham radio events and offers a **SWR simulator** for antenna analysis, allowing users to visualize ROS changes based on frequency and antenna parameters.
-
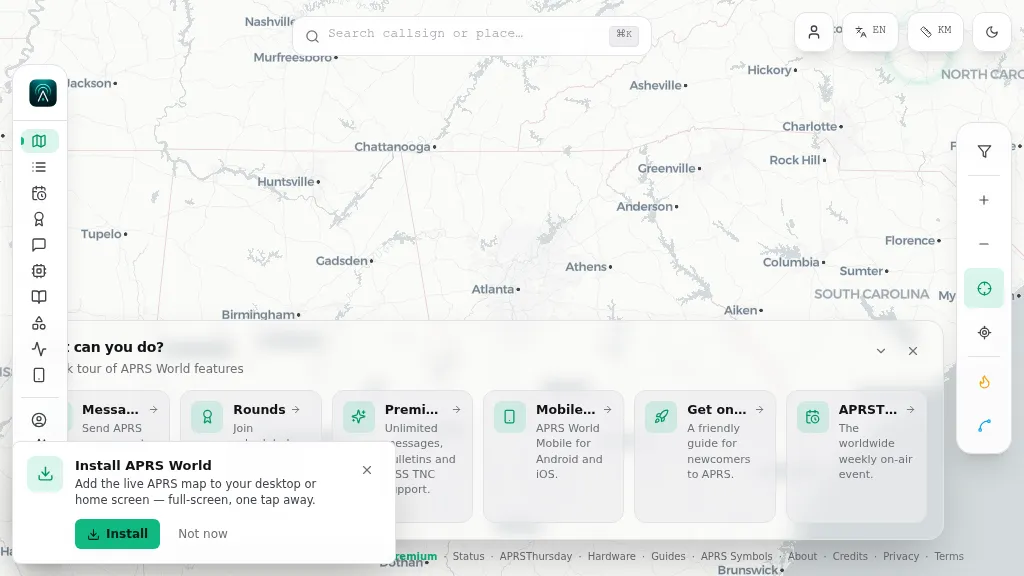 Operating on the Automatic Packet Reporting System (APRS) network, this platform provides a real-time, visual representation of amateur radio stations globally. Users can track callsigns, locate nearby stations, and even send APRS messages directly from a web browser, all without requiring a login. The system integrates live APRS-IS data, presenting it in an intuitive, map-based interface that supports 11 different languages, making it accessible to a broad international audience. Beyond basic station tracking, the platform offers detailed per-station pages, including historical weather data and telemetry logs. This functionality extends to companion Android and iOS applications, which incorporate an RF / KISS-TNC mode, allowing mobile devices to interface directly with APRS via radio. My own field experience with similar APRS visualization tools confirms the utility of such a resource for situational awareness during events or simply monitoring local and regional ham radio activity. The inclusion of weather and telemetry history adds significant value for those interested in environmental data or remote station performance.
-
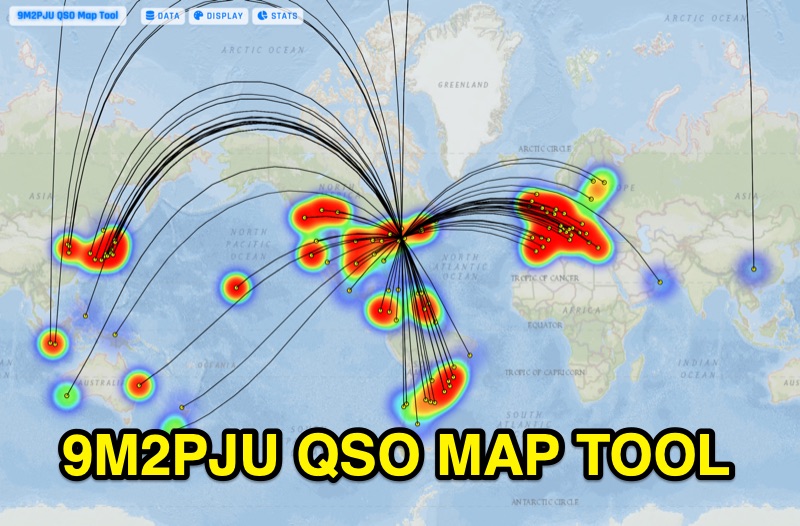 Presents the 9M2PJU QSO Map Tool, a web-based utility designed by Ian Renton for visualizing amateur radio contacts. This tool processes ADIF, Cabrillo, and SOTA CSV log files, allowing operators to plot their QSOs on a selection of base maps, including ESRI NatGeo World Map and OpenStreetMap Mapnik. Users can configure display options such as simple dot markers or xOTA hunter markers, QTH location, outlines, shadows, and geodesic lines, with coloring by band or a fixed hue. The application supports drawing per-band heatmaps and offers overlays for Maidenhead grid squares, CQ zones, ITU zones, and Worked All Britain/Ireland grids. It also provides QSO filtering capabilities and displays comprehensive log statistics, including unique calls, grid squares, CQ zones, ITU zones, and worked DXCCs. Customizable band and mode colors, alongside specific xOTA icons for programs like POTA, SOTA, WWFF, IOTA, and WCA, enhance the visual analysis of operating activity.