Search results
Query: log visualization
Links: 8 | Categories: 0
-
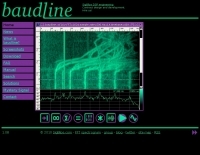 A Linux based FFT spectrum analyzer designed for time-frequency browsing and scientific data visualization. Oscilloscope waveform, statistical histogram, accumulated spectral trace,Weak Signal reception, continuos data logging, FFT Analyzer and specialized measurement windows.
 -
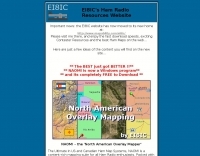 Over 47 full-screen maps are available within _NAOMI_ (North American Overlay Mapper), a free Windows program designed for US and Canadian amateur radio enthusiasts. This mapping suite includes 9 backgrounds such as CQ Zones, ITU Zones, and ARRL Sections, along with 16 foreground layers like Counties, Areacodes, and Grid Locators. Users can calculate distances and bearings, track real-time mouse positions with continuous Grid-Locator data, and integrate with APRS for live station tracking via the FindU database. For a global perspective, the _Global Overlay Mapper_ (GOM) provides a world map, 8 continental maps, and 29 sub-continental maps, all with 12 active layers including Country Outlines, CQ/ITU Zones, and Prefix information. Both NAOMI and GOM offer feature-locate systems to jump to positions based on prefixes, capital cities, or Grid Locators, and provide customized beam headings and distance displays. The site also features _LogView_, a post-contest log visualization tool that analyzes Cabrillo-format logs by plotting QSOs on maps, supporting over 30 major contests like CQWW and ARRL DX, and allowing comparison with published results.
 -
 Time Mapper UHD is a versatile mapping and time visualization program offering multi-satellite viewing with frequency display and unique country-pairs for PskReporter data. It features live feeds from logging programs and can plot ADIF files. Ideal for schools, offices, or amateur radio stations, it provides customizable 4K or HD world clock displays with over 60 map layers, including ham radio zones and natural features. The program supports various time functions and can import logs for detailed analysis. It runs on Windows 10 or 11 and offers a 30-day free trial.
 -
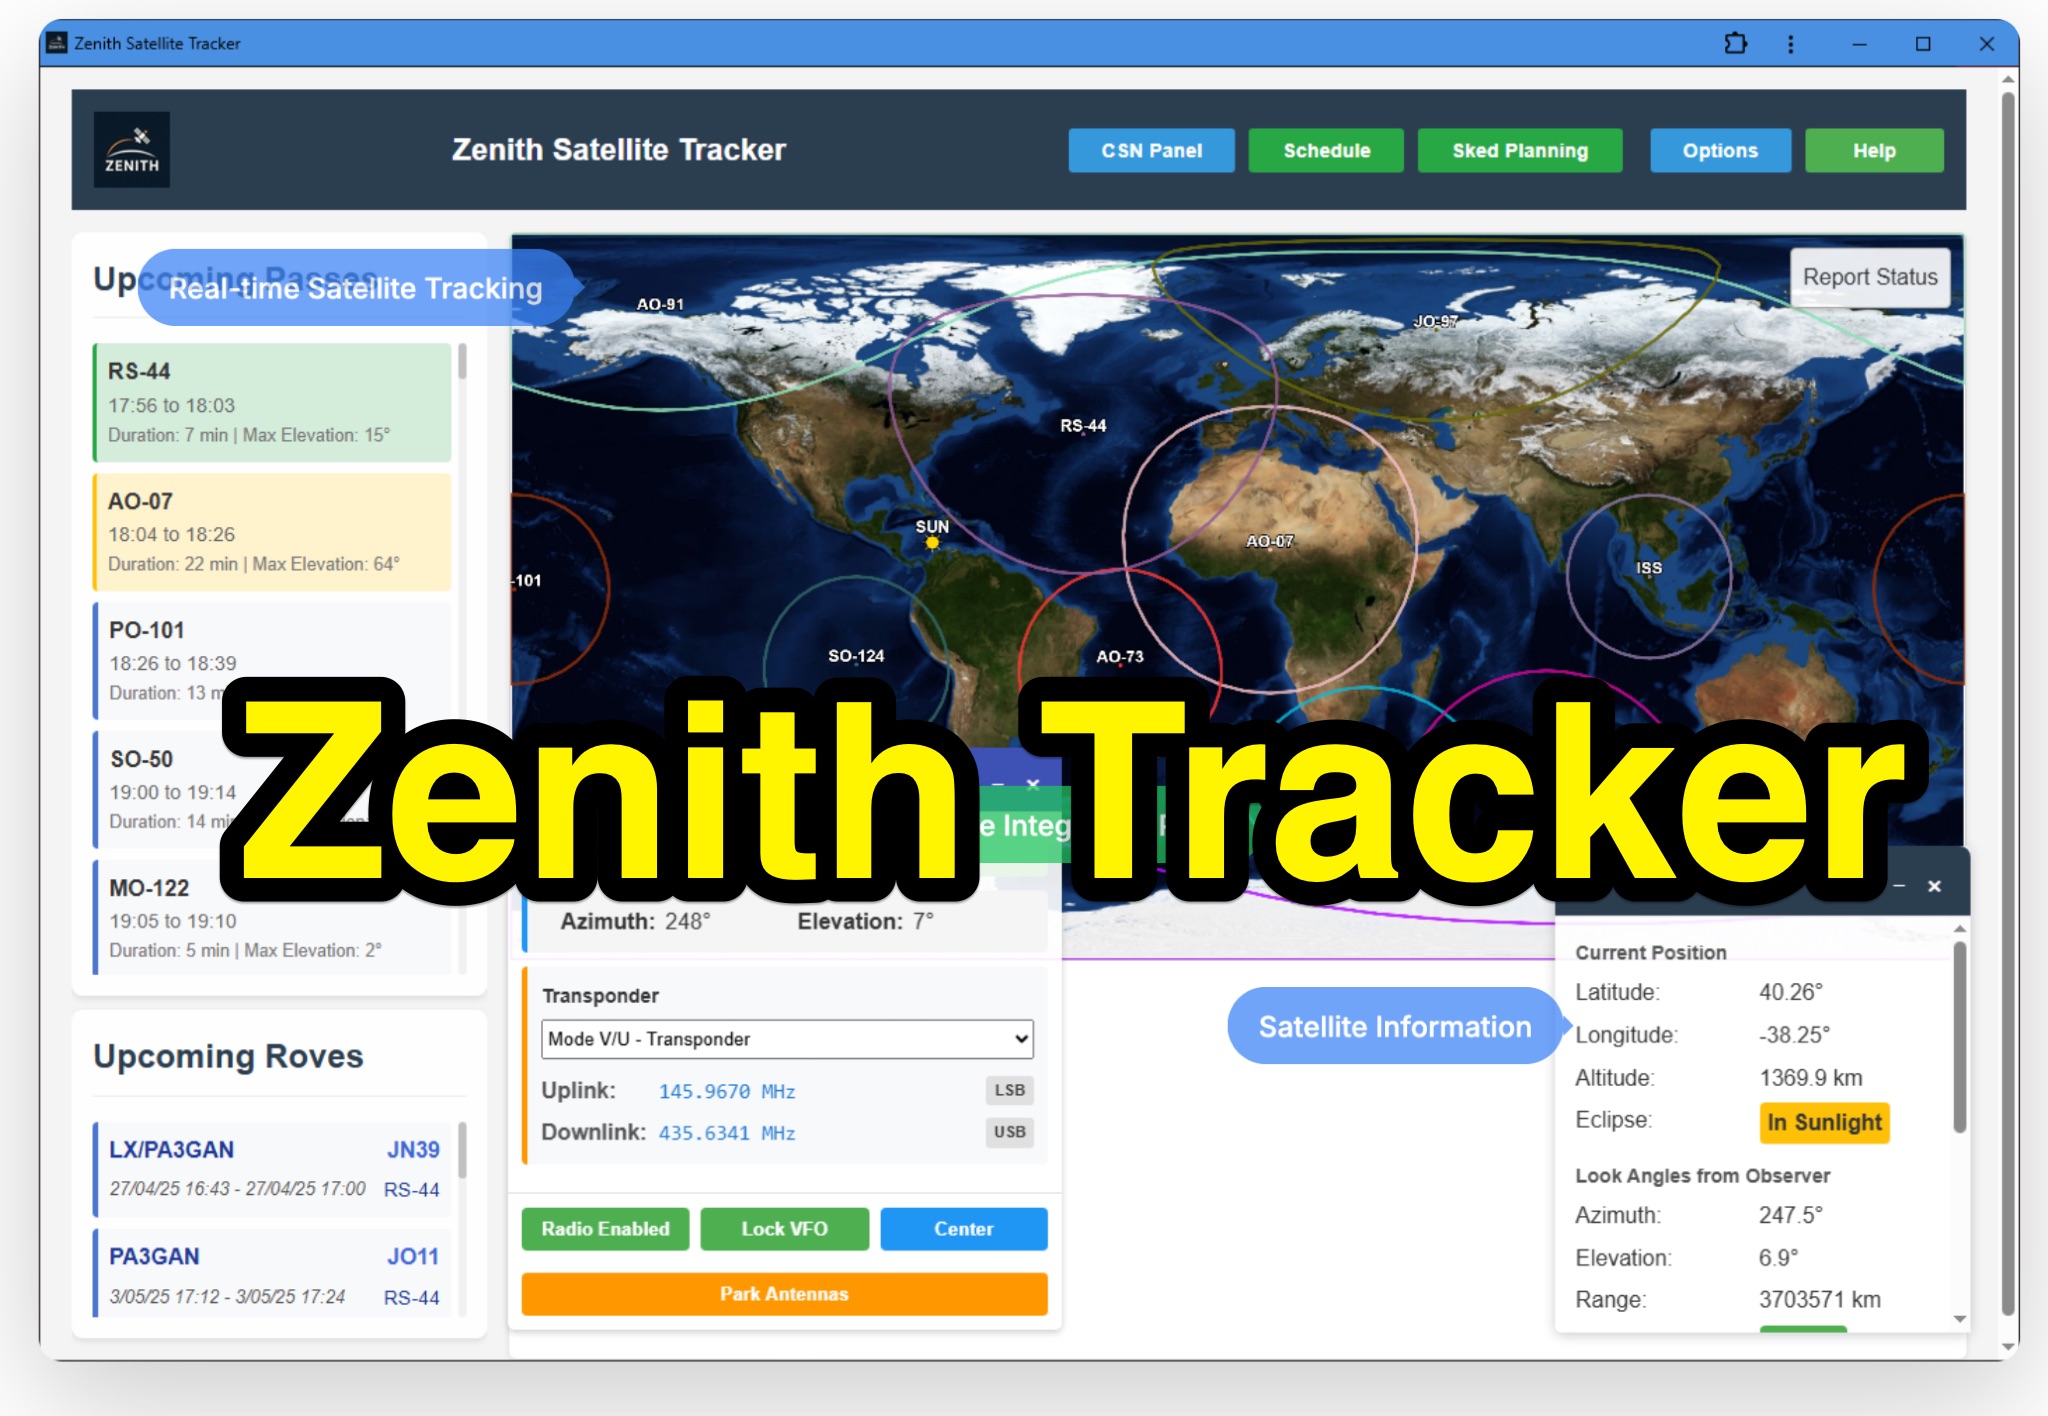 Zenith Tracker offers real-time satellite tracking, pass predictions, and radio hardware integration for ham radio operators. The platform includes an interactive world map showing satellite positions, footprints, and ground tracks, as well as a polar radar visualization for detailed pass analysis. Users can view upcoming passes, set filters, and receive notifications. Integration with CSN Technologies S.A.T Hardware and QTRigDoppler allows for automatic radio control, antenna tracking, and transponder management. The platform also offers APRS message interface, grid square-based location input, and API integration for rover activations. Zenith Tracker is recommended for both general users and those needing advanced hardware integration.
 -
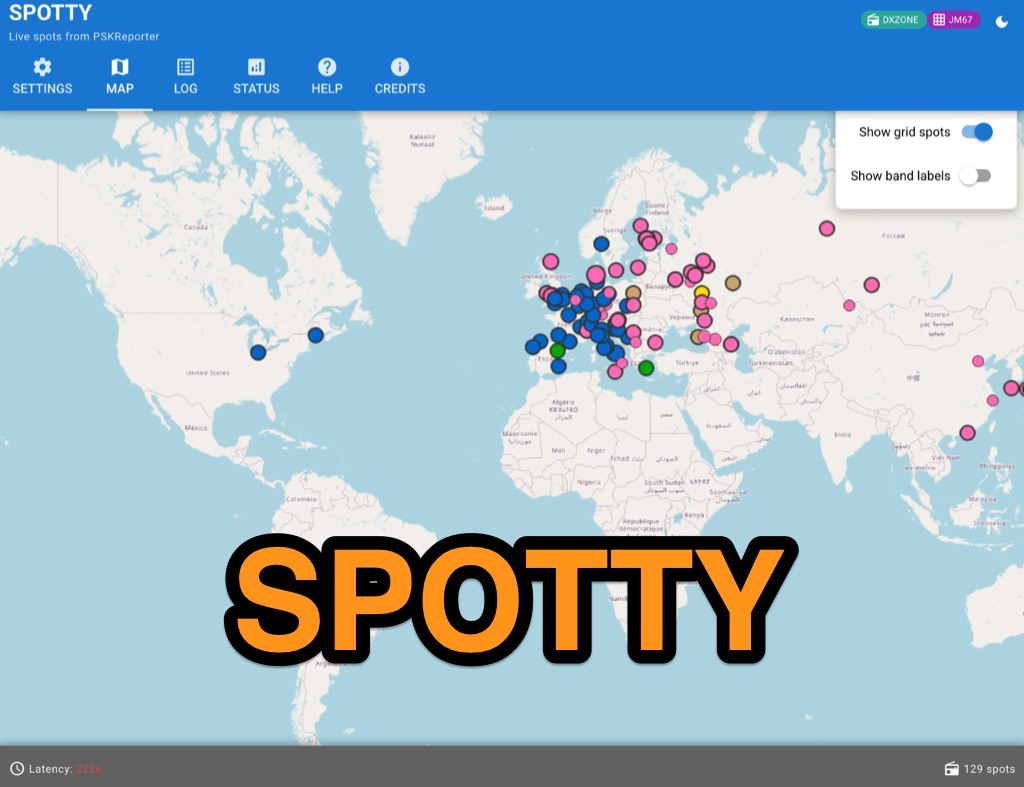 Spotty leverages Philip Gladstone’s pskreporter.info data, delivered via an MQTT broker by Tom Fanning (M0LTE), to offer a responsive web application for visualizing propagation. The Map View presents a default visualization (grid AA00 / callsign MY8CALL) and distinguishes signal types: small spots for signals heard by a location, large spots for transmissions from a location, and teardrop markers for transmissions from the monitored callsign. Clicking a spot reveals detailed signal data in an overlay. The application includes a Log View for raw spot data and a Settings tab for customization. Users can filter tracking by specific Callsign or Grid, with preferences saved to the browser. A notable feature is the Time to Live (TTL) setting, adjustable from the default 60 seconds, which controls spot visibility duration to manage map clutter during high-traffic periods. The tool provides a clear, logic-driven interface for real-time signal monitoring.
 -
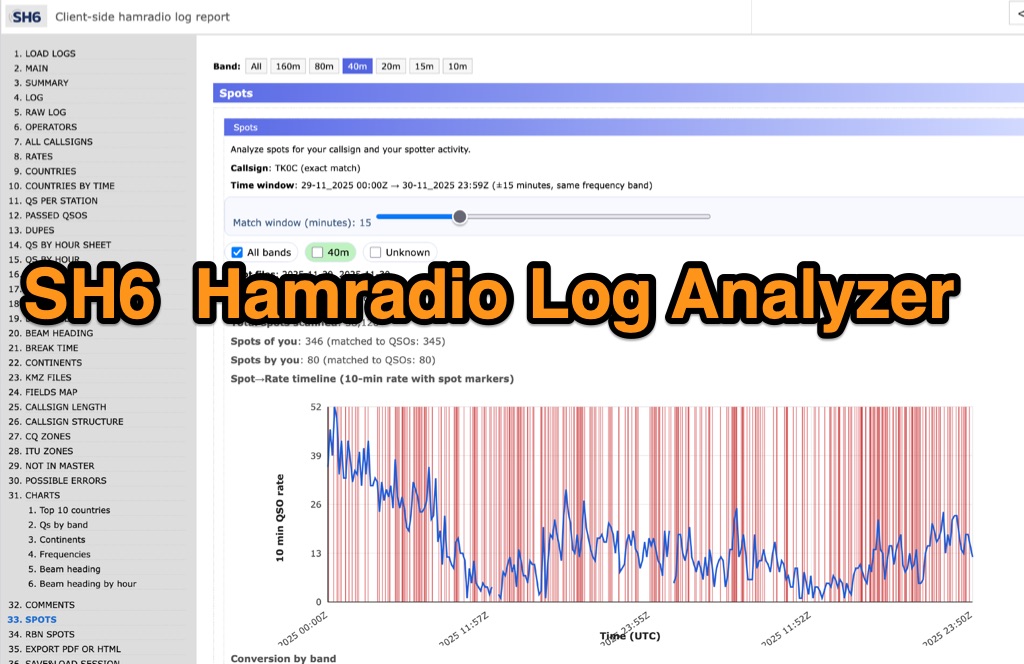 SH6 is a versatile, browser-based utility designed for the detailed analysis and visualization of amateur radio contest logs. Supporting standard formats such as Cabrillo and ADIF, the tool allows operators to upload personal files via drag-and-drop or access a searchable public archive containing over one million logs. Key capabilities include comprehensive performance metrics, offering summaries of band breakdowns, QSO rates, and beam headings. Furthermore, SH6 provides advanced geographic visualization through interactive maps, analyzing contacts by country, zone, and continent. A standout feature is the side-by-side comparison mode, enabling users to contrast two distinct logs for strategic assessment. SH6 transforms raw log data into actionable insights regarding operator performance without requiring software installation.
 -
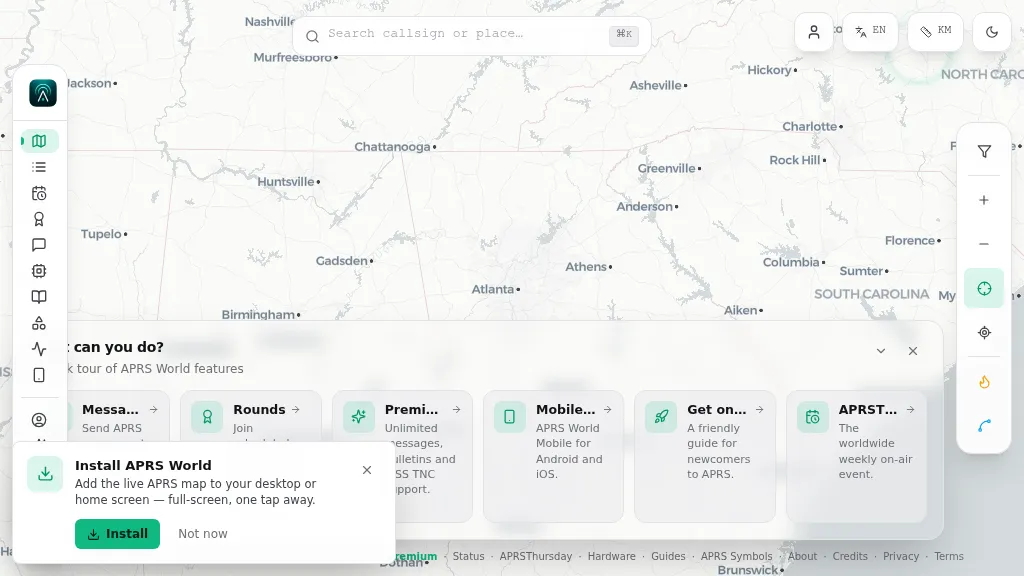 Operating on the Automatic Packet Reporting System (APRS) network, this platform provides a real-time, visual representation of amateur radio stations globally. Users can track callsigns, locate nearby stations, and even send APRS messages directly from a web browser, all without requiring a login. The system integrates live APRS-IS data, presenting it in an intuitive, map-based interface that supports 11 different languages, making it accessible to a broad international audience. Beyond basic station tracking, the platform offers detailed per-station pages, including historical weather data and telemetry logs. This functionality extends to companion Android and iOS applications, which incorporate an RF / KISS-TNC mode, allowing mobile devices to interface directly with APRS via radio. My own field experience with similar APRS visualization tools confirms the utility of such a resource for situational awareness during events or simply monitoring local and regional ham radio activity. The inclusion of weather and telemetry history adds significant value for those interested in environmental data or remote station performance.
 -
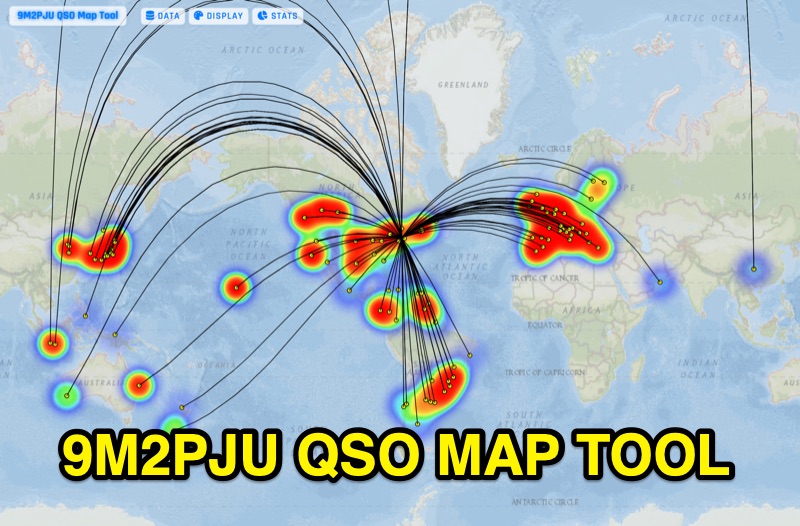 Presents the 9M2PJU QSO Map Tool, a web-based utility designed by Ian Renton for visualizing amateur radio contacts. This tool processes ADIF, Cabrillo, and SOTA CSV log files, allowing operators to plot their QSOs on a selection of base maps, including ESRI NatGeo World Map and OpenStreetMap Mapnik. Users can configure display options such as simple dot markers or xOTA hunter markers, QTH location, outlines, shadows, and geodesic lines, with coloring by band or a fixed hue. The application supports drawing per-band heatmaps and offers overlays for Maidenhead grid squares, CQ zones, ITU zones, and Worked All Britain/Ireland grids. It also provides QSO filtering capabilities and displays comprehensive log statistics, including unique calls, grid squares, CQ zones, ITU zones, and worked DXCCs. Customizable band and mode colors, alongside specific xOTA icons for programs like POTA, SOTA, WWFF, IOTA, and WCA, enhance the visual analysis of operating activity.