Search results
Query: maidenhead grid square location
Links: 4 | Categories: 0
-
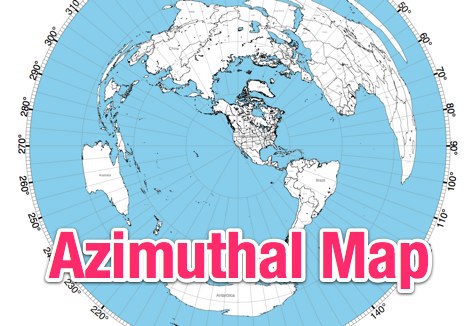 NS6T's Azimuthal Map generator provides a web form for creating custom azimuthal projections centered on a user-specified QTH. Users can input their location using latitude/longitude coordinates, a Maidenhead grid square (e.g., IO91um), or a city name, with support for both US and international locations. The system processes these inputs to render a map displaying true bearings from the specified origin. Output customization includes options for distance, with a recommendation for 17500 kilometers and 8.5" x 11" paper size for integration with PSTRotator software. The generated PDF can be zoomed and clipped for use as a .jpg file in PSTRotator/Maps directories. The tool also offers an experimental color azimuthal map variant. City data for non-US locations is sourced from The World Gazetteer. The resource encourages user feedback and problem reports via comments on the associated blog, aiming for continuous improvement of the mapping utility.
 -
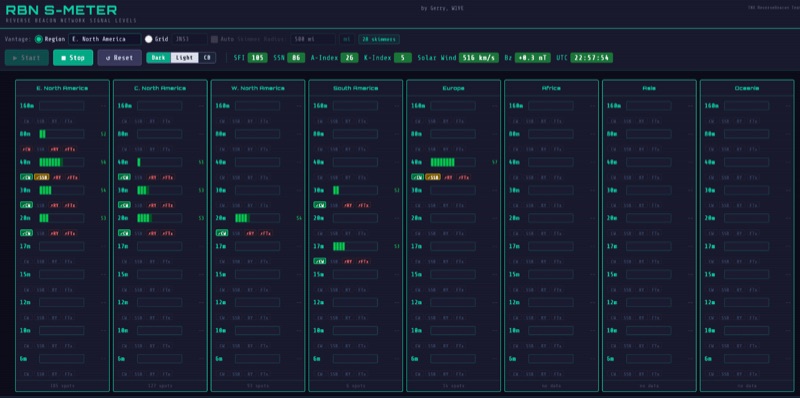 The RBN S-Meter visualizes real-time HF propagation data from the Reverse Beacon Network (RBN). It processes thousands of automated spots per hour, providing a real-time picture of active RF paths on HF bands. Users can set their vantage point using _Region Mode_ or _Grid Square Mode_. Region Mode allows selection from broad geographic areas like E. North America or Europe, while Grid Square Mode uses a Maidenhead grid square and radius for more precise data. The app displays eight region panels, each with horizontal bars for bands 160m through 6m, indicating signal strength with a color ramp from green to red. A dimmer trail shows peak hold values, and an S-unit readout provides additional detail. The app is a free web application accessible on any device, offering a practical tool for ham radio operators interested in CW, RTTY, and FT8 signals. It features a Progressive Web App installation option for enhanced usability on mobile and desktop platforms. Users can install it on Android, iOS, and Windows devices, providing a native app-like experience. The app replaces the previous Windows standalone executable, incorporating user feedback to improve features like grid square mode and automatic location detection.
 -
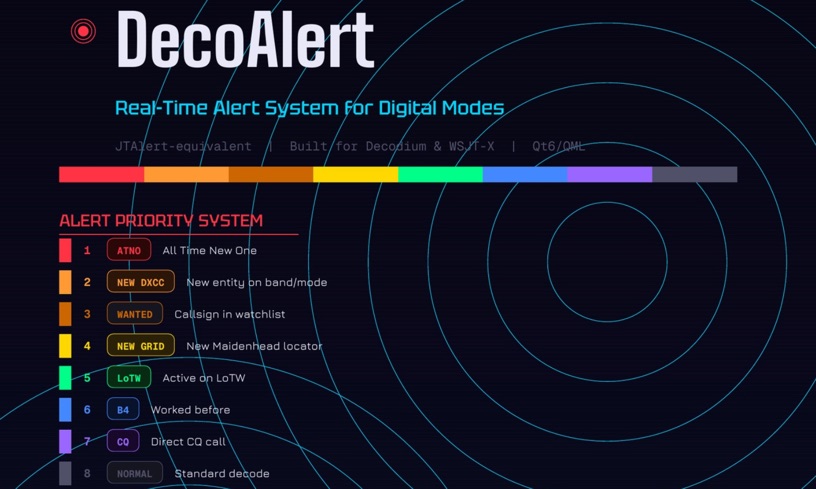 DecoAlert 1.0 Beta is a companion application designed to enhance the digital mode operating experience, specifically for FT8, FT4, and FT2. It operates by monitoring UDP data streams from primary decoding software like _Decodium_ and _WSJT-X_ on port 2237. The software provides real-time, priority-based audio alerts using WAV sounds for various conditions, including All Time New Ones (ATNO), new DXCC entities per band/mode, user-defined watchlist callsigns, new Maidenhead grid squares, and LoTW-active stations. It also highlights previously worked stations (B4) and integrates live DX spots from Telnet clusters, offering a comprehensive suite of tools for serious digital mode operators. The application features a built-in SQLite database for tracking worked stations and integrates with LoTW user lists to identify confirmed contacts. A DX Cluster client supports multiple Telnet servers, providing a broad view of propagation. PSKReporter statistics are available by band and mode, offering insights into signal paths. The QSO log viewer includes search and filter capabilities, while an _OpenStreetMap_ (OSM) interface visualizes spot locations, aiding in situational awareness. DecoAlert requires Windows 10/11 (64-bit) and compatible digital mode software configured to send UDP data.
 -
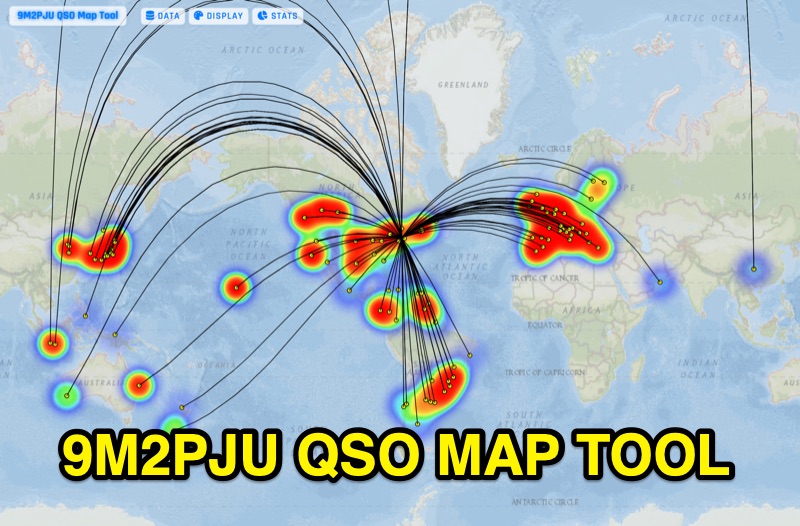 Presents the 9M2PJU QSO Map Tool, a web-based utility designed by Ian Renton for visualizing amateur radio contacts. This tool processes ADIF, Cabrillo, and SOTA CSV log files, allowing operators to plot their QSOs on a selection of base maps, including ESRI NatGeo World Map and OpenStreetMap Mapnik. Users can configure display options such as simple dot markers or xOTA hunter markers, QTH location, outlines, shadows, and geodesic lines, with coloring by band or a fixed hue. The application supports drawing per-band heatmaps and offers overlays for Maidenhead grid squares, CQ zones, ITU zones, and Worked All Britain/Ireland grids. It also provides QSO filtering capabilities and displays comprehensive log statistics, including unique calls, grid squares, CQ zones, ITU zones, and worked DXCCs. Customizable band and mode colors, alongside specific xOTA icons for programs like POTA, SOTA, WWFF, IOTA, and WCA, enhance the visual analysis of operating activity.