Search results
Query: smith charts
Links: 11 | Categories: 0
-
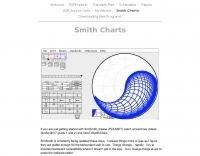 SimSmith is a highly interactive, real time Smith chart graphing program. Circuits are constructed using drag-n-drop. Load files can be imported from the EZNEC and CocoaNEC antenna simulation software and from the AIM4170 and miniVNApro antenna analyzers. Circuits and load files can be of any size. Key Features: SimSmith is one of the few Smith chart packages which models transmission line losses. SimSmith also allows the description of circuit elements using algebraic equations. SimSmith has only one screen and allows the screen to be resized to increase workspace or readability.
 -
 The ZS6BKW multiband antenna, an optimized variant of the classic G5RV, features a 102-foot (31.1 m) horizontal span and a 39.1-foot ladder line matching section. This design, derived by G0GSF (formerly ZS6BKW) in the early 1980s using computer programs and _Smith charts_, aims for improved SWR across multiple HF bands compared to its predecessor. Construction details specify Wireman 554 ladder line and #14 AWG THHN copper wire for the radiators, with precise instructions for determining the velocity factor (VF) of the ladder line using an antenna analyzer or dip meter, ensuring accurate physical length for the matching section. The radiator length is electrically 1.35 wavelengths for the 20-meter band, requiring careful trimming during tuning. Field measurements with an _AIM-4170C_ analyzer by KI4PMI and NC4FB demonstrated good SWR curves and bandwidth on 6, 10, 12, 17, 20, and 40 meters. The antenna was deemed unusable on 15 and 30 meters due to very high SWR, but an LDG AT-100PRO autotuner successfully brought 6 and 80 meters into tune. Contacts were made on 80, 40, 20, and 17 meters, including a **17-meter** contact to Spain. EZNEC models for 80-6 meters are provided, along with an AutoEZ model by AC6LA, which predicted good SWR for 80-10 meters. W5DXP's modifications for an all-band HF ZS6BKW are also referenced.
 -
 The Smith Chart program with its extensive Help files. Written in Visual C++ ver 1.5, it runs in Windows 3.1 and later by w9dmk
 -
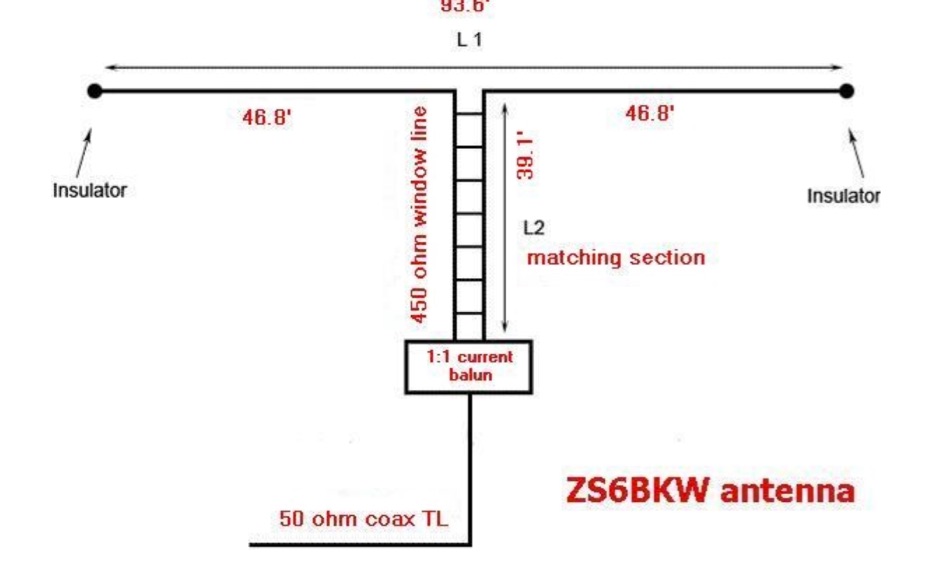 The ZS6BKW multi-band antenna, an optimized variant of the classic G5RV, is presented with detailed construction and tuning instructions. This resource outlines the antenna's design principles, which were developed by _Brian Austin (G0GSF)_ using computer programs and Smith charts to achieve optimal dimensions. It provides specific guidance on calculating and adjusting the lengths of the radiators (L1) and the matching ladder line (L2), emphasizing the critical role of velocity factor (VF) in achieving resonance. The article includes a step-by-step procedure for empirically determining the VF of ladder line using an antenna analyzer, ensuring accurate physical lengths for the matching section. It details the tuning process for the radiators, offering practical tips for incremental adjustments to achieve the best SWR curve. The resource presents SWR measurement results obtained with an _AIM-4170C_ analyzer across multiple bands, alongside predicted SWR graphs from an AutoEZ model. It confirms successful contacts on 80, 40, 20, and 17 meters, including a **17-meter DX contact** to Italy. EZNEC and AutoEZ models for the ZS6BKW antenna, covering 80 through 6 meters, are provided for download, allowing further analysis and customization. The document specifies component details, such as the use of Wireman 554 ladder line and #14 AWG THHN copper wire, and discusses the antenna's performance characteristics, noting high SWR on 15 and 30 meters but successful tuning on 6 and 80 meters with an external tuner.
 -
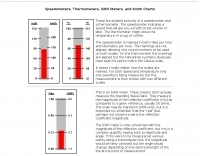 Have wondered why a Smith chart has such strange grid lines. Believe it or not, there is a logical progression from Speedometers to Smith charts that will make the Smith grid crystal clear.
 -
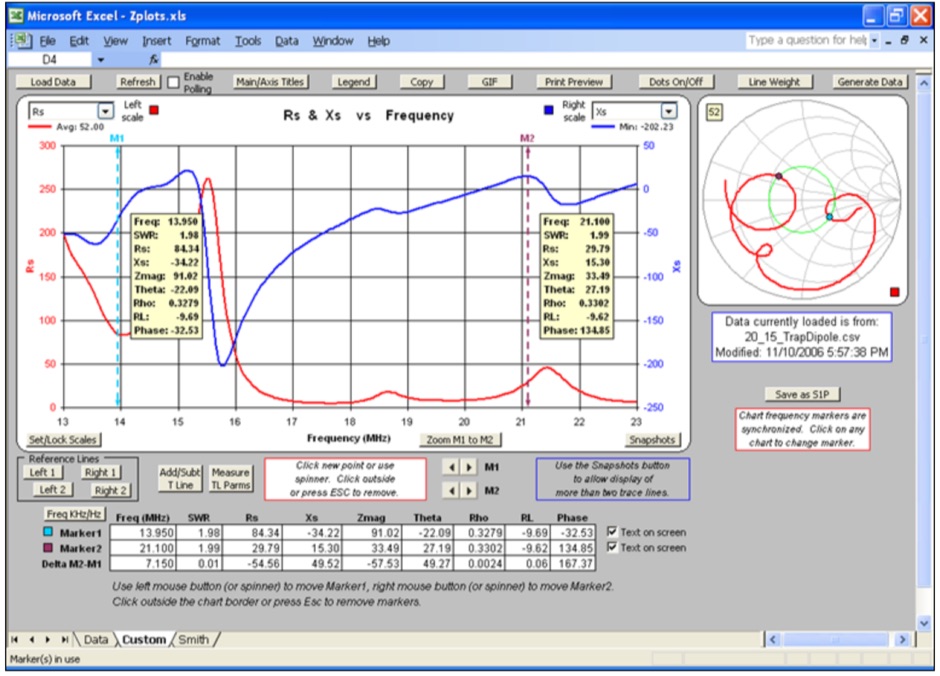 Zplots is an Excel application that allows you to plot impedance and related data obtained from a variety of sources. You can plot on both an XY chart and a Smith chart as well as view the data in tabular format. The XY chart can be customized with your choice of trace lines. Frequency (in MHz) is always shown on the X axis.
 -
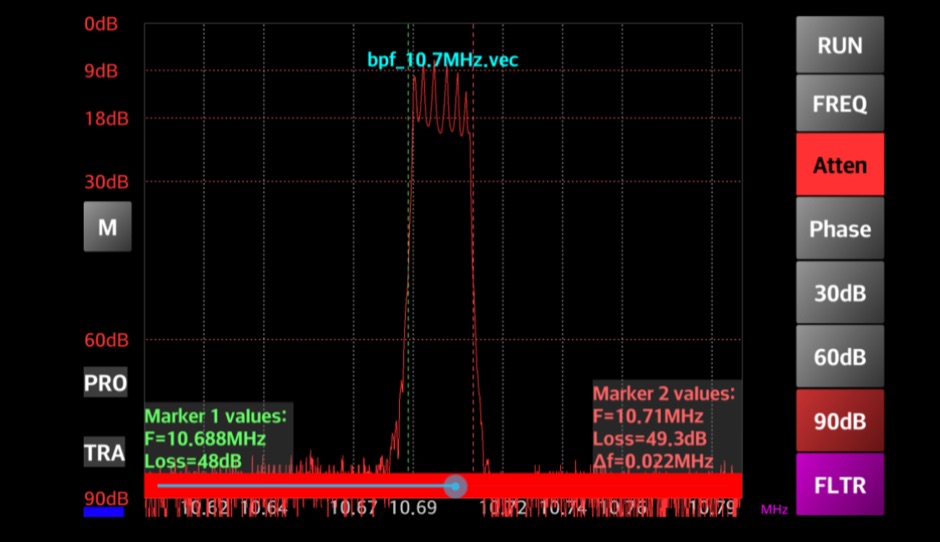 Enables Android users to operate various _miniVNA_ antenna analyzers via Bluetooth, USB, or Wi-Fi, providing a portable solution for RF measurements. The application supports full control over data acquisition, offering features like custom frequency range selection from 1 KHz to the VNA's full range, and automatic screen adaptation for diverse Android device resolutions. It facilitates intuitive, wizard-based calibration for both reflection and transmission modes, saving calibration data for different VNA types (Standard, Pro, Pro with Extender) to avoid repeated procedures. The software displays critical parameters such as SWR, |Z|, Return Loss, Phase, Rs, and |Xs| on 2-axis graphs or Smith charts, with multi-touch gestures for zoom and frequency shift. It includes a frequency generator mode with independent channels and attenuator control for the miniVNA Pro, along with a sweeper function. The cable data mode automatically calculates phase and loss, measures cable length from less than 1 meter to hundreds of meters, and includes a table of common coax cable velocity factors. An experimental X-tal mode measures resonance frequency, Rs, and Q. Data export options include CSV, ZPLOT, and S1P formats, with CSV import capability. The application also features an SM6ENG Audio mode for SWR tuning without visual reference and provides a miniVNA battery voltage indicator. It supports a wide frequency range, with the miniVNA Extender extending coverage up to **1500 MHz**. The application is compatible with Android version 2.2 and later, tested on devices like the _Galaxy TAB 7.7 P6800_.
 -
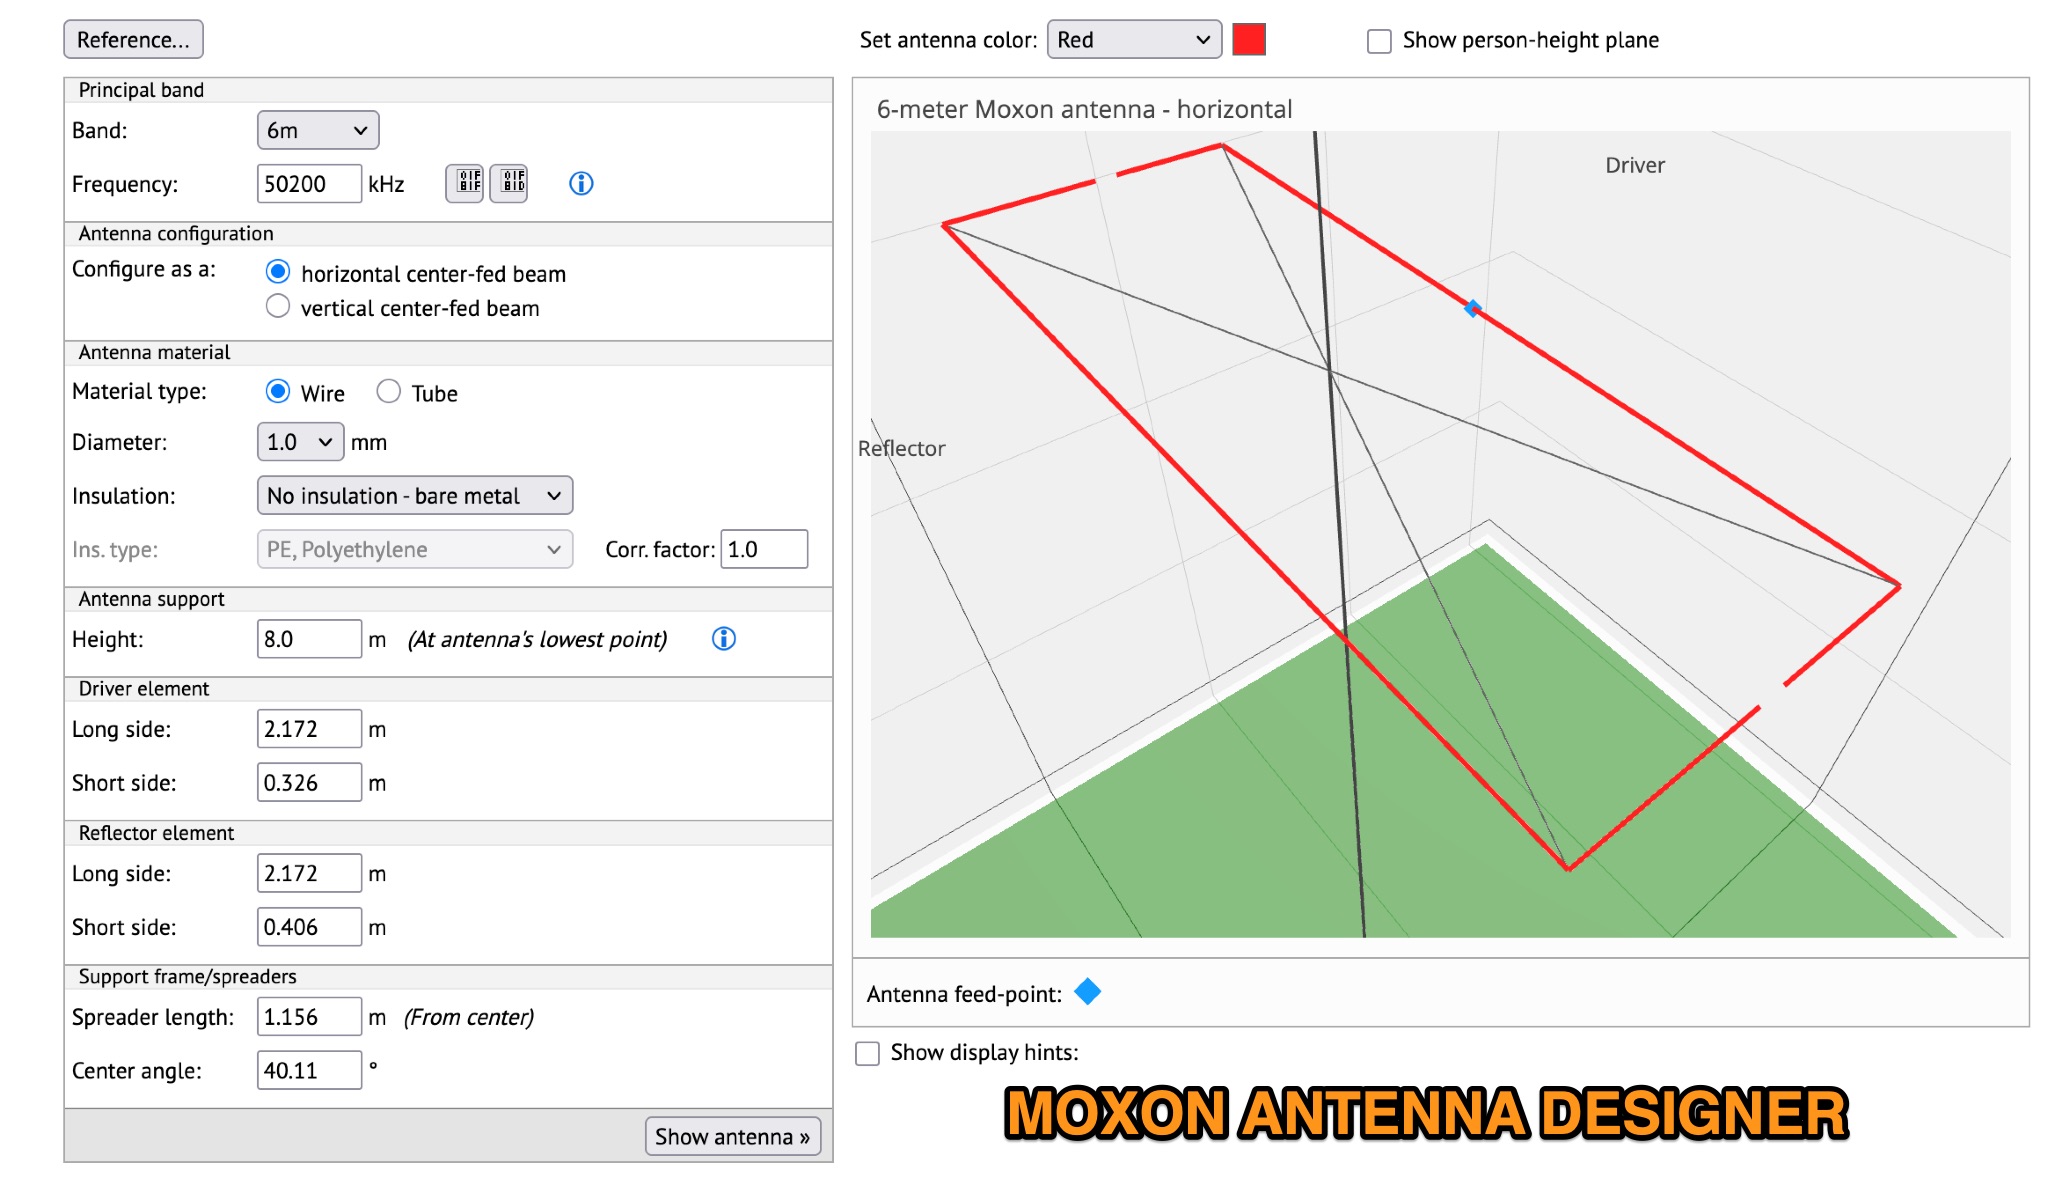 Presents an interactive online **Moxon antenna designer** tool, enabling radio amateurs to configure and analyze lightweight Moxon antennas for HF and VHF bands. Users can specify design frequency, element lengths, wire diameter, insulation, and support height. The tool visualizes the antenna in interactive 3D graphics and generates comprehensive performance charts, including azimuth, elevation, 3D, and polarization radiation patterns, VSWR charts, antenna current diagrams, and Smith charts. It also allows selection of various ground types (e.g., very poor soil, salt water, free space) to model environmental effects on antenna performance. The designer provides insights into how physical dimensions and ground conditions influence key antenna parameters like forward gain, front-to-back ratio, and feed-point impedance, which is typically close to 50 ohms. It also includes a feature to model the effect of coaxial cable losses on **VSWR** at the transmitter end, distinguishing it from the feed-point VSWR. This helps operators understand the actual radiated power efficiency versus the apparent match at the transceiver, offering a practical perspective on antenna system performance in portable operations.
 -
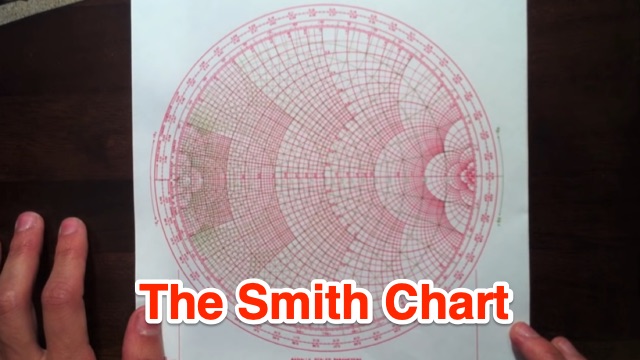 This tutorial introduces and explains Smith Charts, and then gives an introduction to impedance matching. Smith Chart is a tool to visualize the impedance of a transmission line and antenna system as a function of frequency.
 -
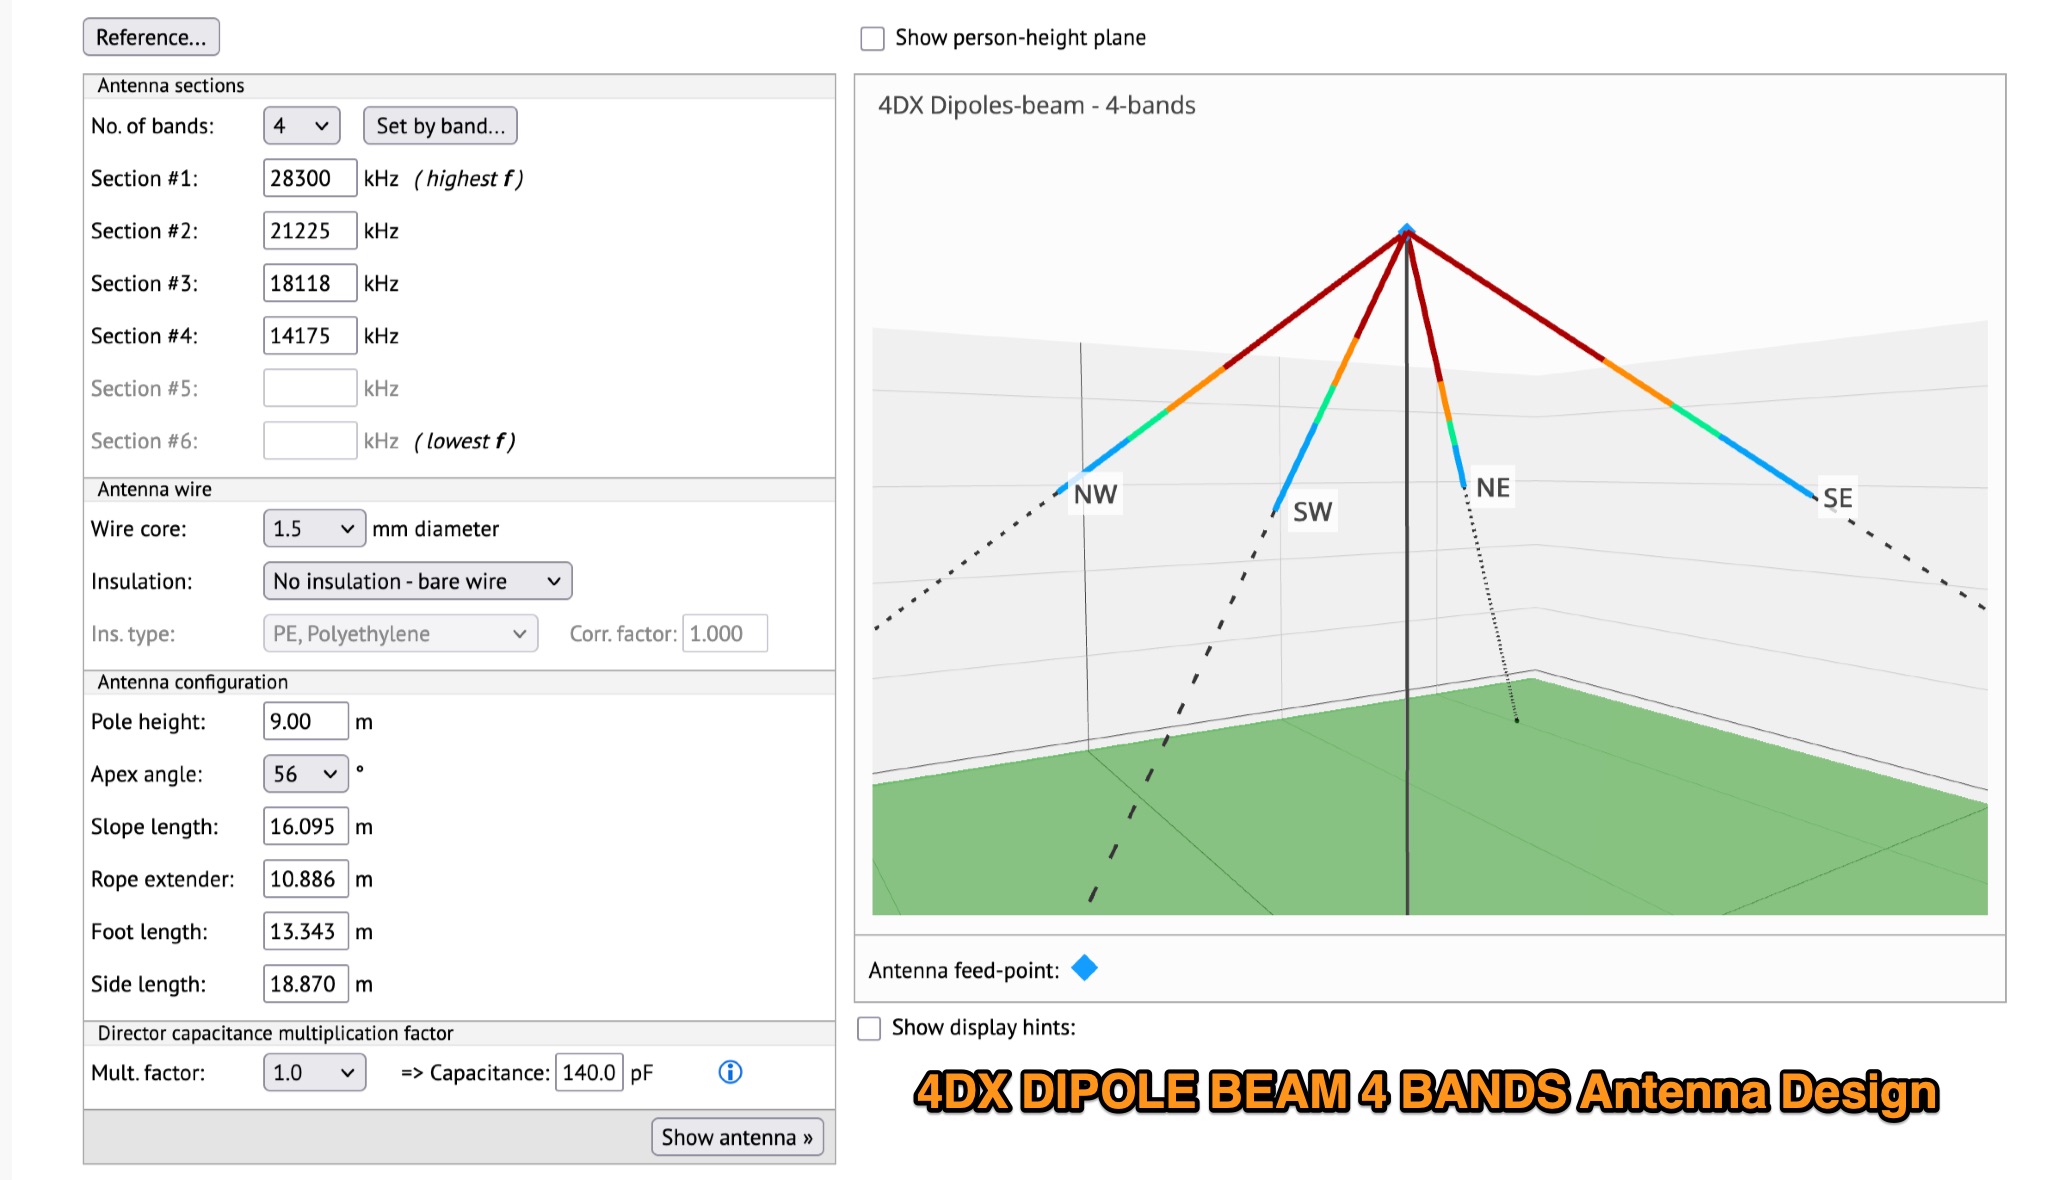 This page provides detailed information on the 4DX directional wire beam antenna designed by LZ1AQ, LZ1ABC, VK6LW, and DD5LP. It explains how to create this antenna for single or multiple bands using four separate sloping wires. The page includes instructions on achieving directionality, gains, and F/B ratios, as well as generating radiation patterns, VSWR charts, antenna currents diagrams, and Smith charts. It is a valuable resource for hams interested in building and optimizing their own directional wire beam antennas for improved performance and long-distance contacts.
 -
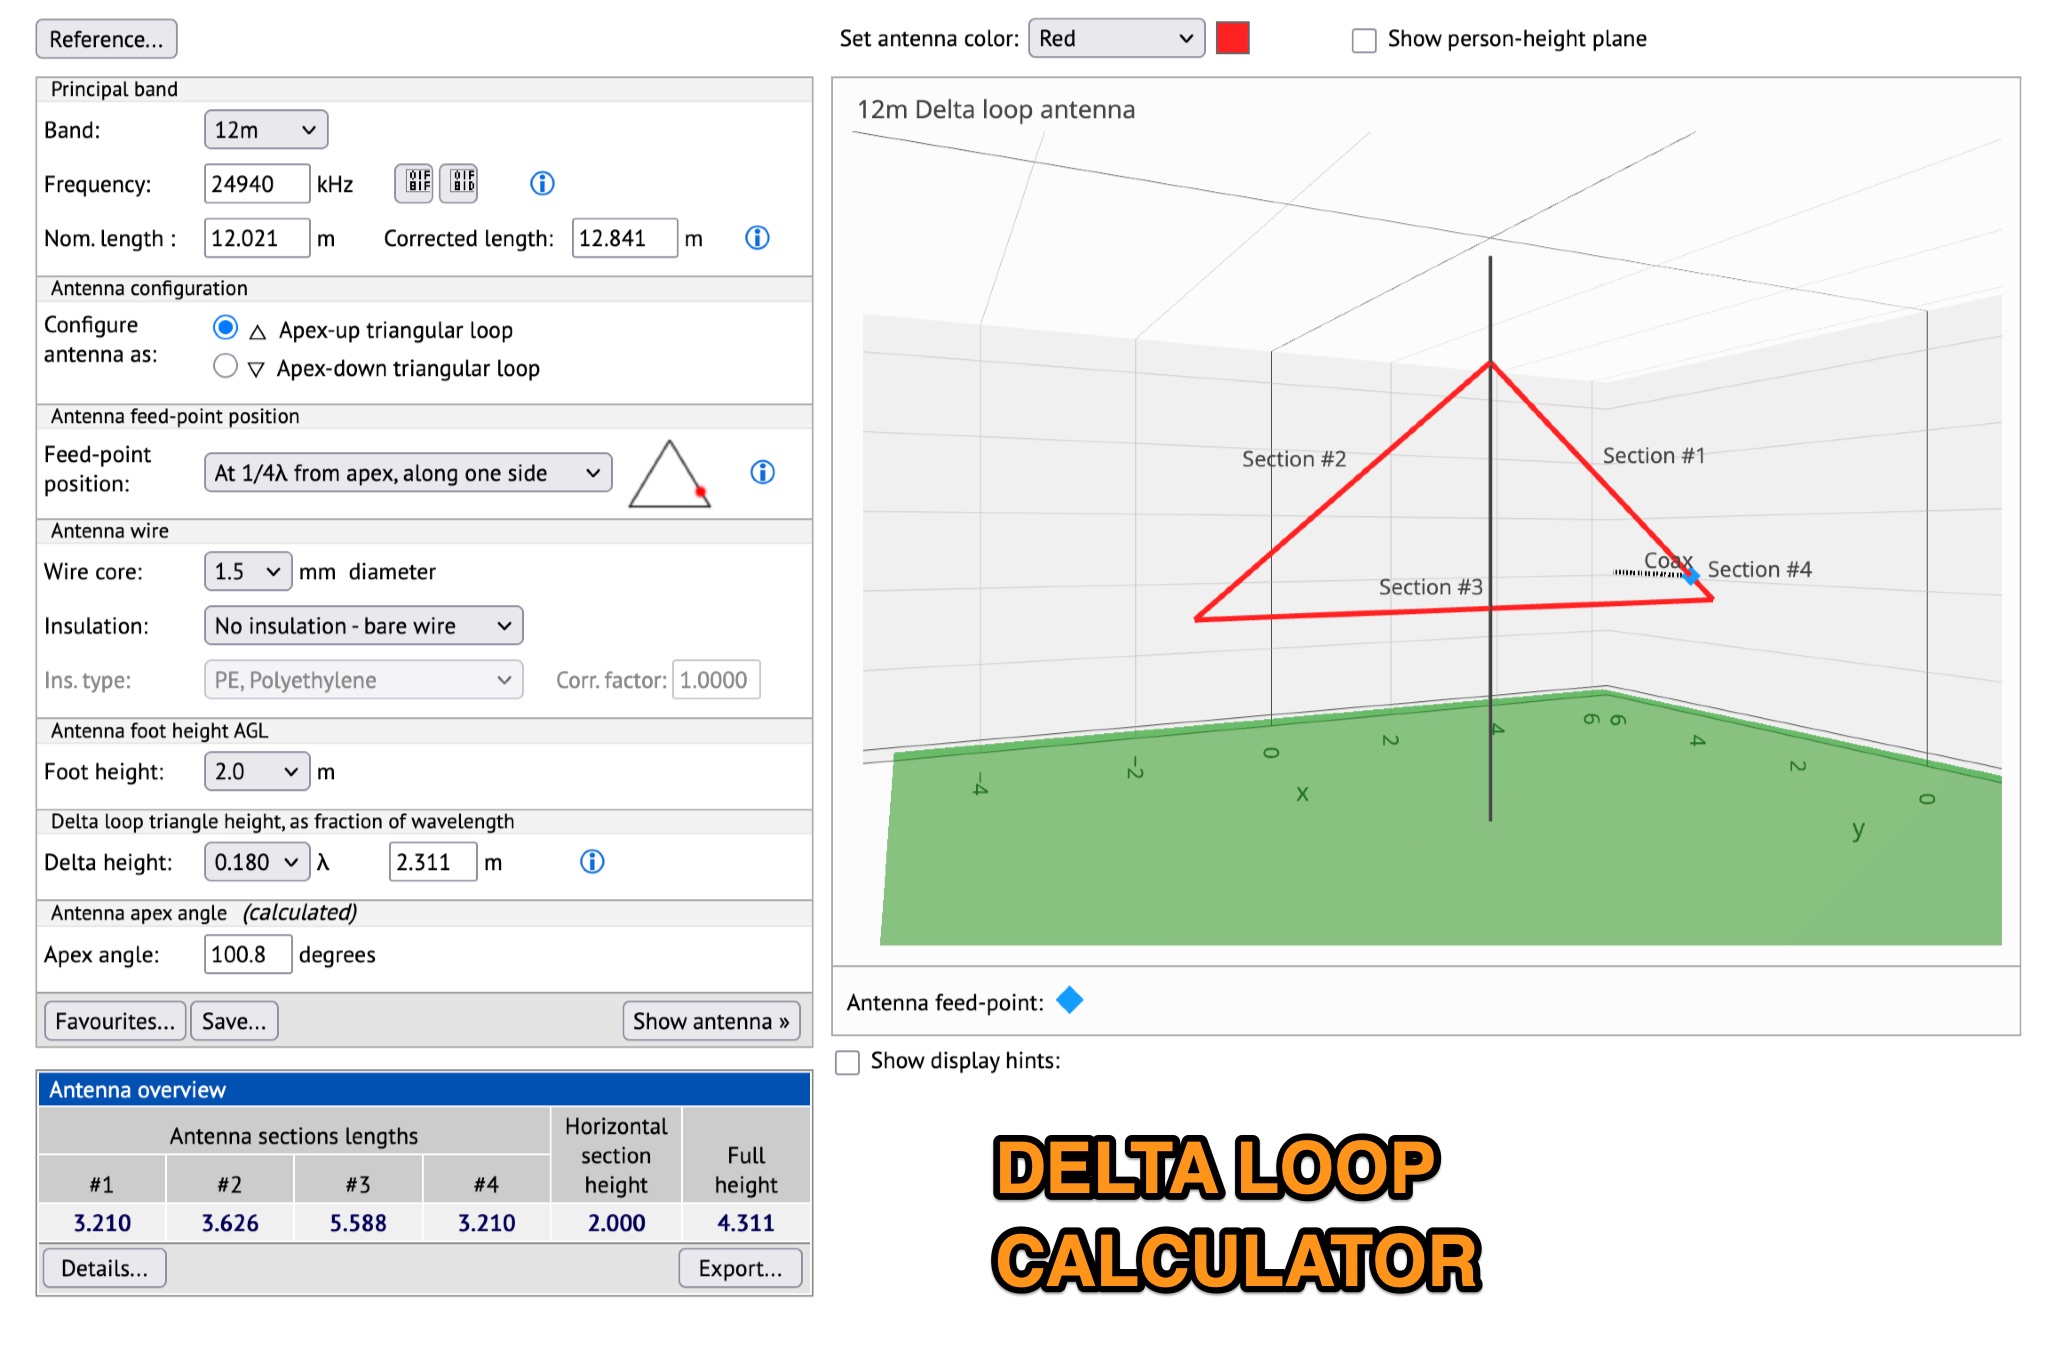 This page allows hams to design a vertical-plane delta-loop antenna for a single amateur HF band in different configurations. By choosing different feed-point positions, operators can observe variations in polarization properties, radiation patterns, and feed-point impedances. Users can generate radiation pattern plots, VSWR charts, antenna current diagrams, and Smith charts for their antennas over various ground types. Through adjusting the antenna's physical dimensions and refreshing the plots, hams can gain insights into the antenna's performance in the field. The page also discusses how elevation radiation patterns may change based on the antenna configuration and feed-point position.