Search results
Query: grid location
Links: 16 | Categories: 0
-
 Over 200 Telnet DX cluster entries are meticulously cataloged, each providing the cluster's callsign, IP address or hostname, and the specific port for connection. The resource details the geographic location for each cluster, often including grid square information or city/country, which is crucial for operators seeking regional or local spotting networks. For instance, **AB5K** offers both worldwide and USA/Canada-only spot feeds, while **K2LS** explicitly limits spots to USA/Canada/Caribbean Zones 1-8, excluding chat messages. The compilation serves as a practical reference for amateur radio operators who utilize traditional Telnet clients for real-time DX spotting. It presents a raw, unadorned list, prioritizing direct access information over elaborate interfaces. This format allows for quick integration into logging software or terminal programs that support Telnet connections. Distinctively, the resource focuses exclusively on Telnet access, differentiating it from web-based or aggregated cluster services. The sheer volume of listed clusters, spanning continents from Europe and North America to Asia and Oceania, makes it a robust tool for DXers and contesters aiming to monitor propagation and identify rare DX stations across various bands.
 -
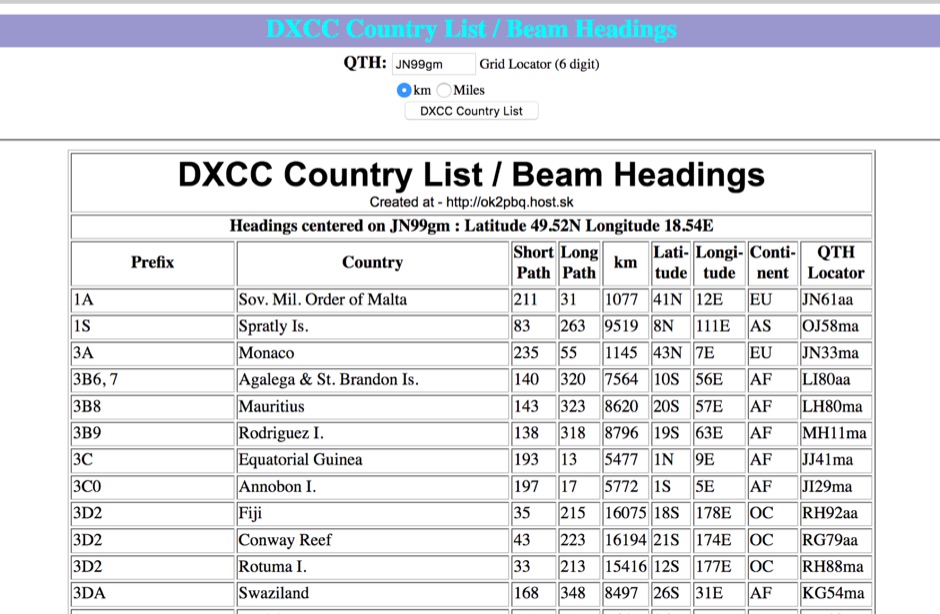 You can have your persolal DXCC country list with correct beam heading calculated on you grid square location
 -
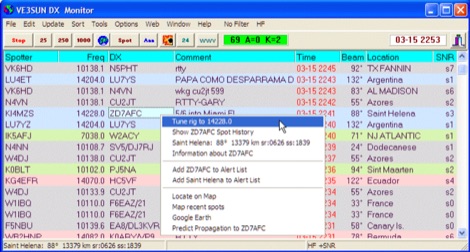 VE3SUN DX Monitor is a standalone Windows program which monitors the DX announcements available on the internet at DX Summit and presents the information in a sortable grid format and on a map centered on your location. Price USD 39.95
 -
 The AZIMUTH program plots a world map in either azimuth (beam heading) or Mercator projections. If you specify your home location in latitude and longitude, the azimuth projection is centred on your location. The Azimuth map program can display Maidenhead grids - this is useful for 6m, 2m, and UHF DX communication display. Various features of the map are: Azimuth or Mercator projections , Maidenhead grid display, Simple map zooming, Print maps with adequate resolution up to one meter sized map
 -
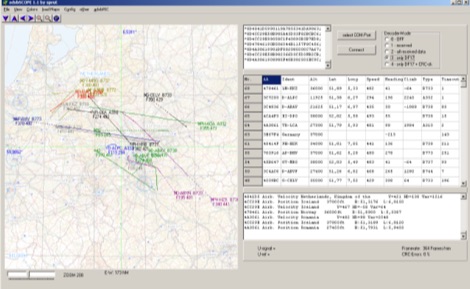 adsbScope is a freeware Windows application designed for processing _ADS-B_ (Automatic Dependent Surveillance-Broadcast) frames received from a compatible decoder. It identifies aircraft, calculates their real-time positions, and presents flight parameters in both alphanumeric tables and a graphical display. The software interfaces via a virtual COM port, receiving raw frames to provide detailed situational awareness, including a global coordinate grid, continental coastlines, over 4,000 **airport** locations, and major cities. Users can overlay OpenStreetMap tiles and view world state boundaries, with each tracked aircraft rendered with labels showing altitude, speed, heading, squawk code, and flight identifiers. When paired with the adsbPIC-decoder, adsbScope enables advanced hardware control, allowing users to toggle data filters for specific frames like DF17/18/19, adjust analog signal thresholds for reception fine-tuning, and manage system resets or bootloader activation directly from the PC. This functionality provides a customizable toolkit for hobbyist radar listeners, offering a robust alternative to commercial tools for processing aircraft data. The software displays up to **1090 MHz** transponder data and can track aircraft up to 250 nautical miles.
 -
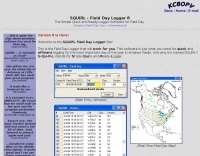 Demonstrates the _SQUIRL Field Day Logger_, a specialized software tool designed for efficient contact logging during the annual ARRL Field Day event. The resource details its core functionality, which includes real-time logging to easily readable text files, with filenames structured by callsign, band, and mode (e.g., K8DAA-20M-SSB.txt). It highlights features such as a real-time history grid of previous contacts, a dynamic USA and Canada map displaying contact locations, and a duplicate checker that provides audio notifications and pre-fills class/section data for previously worked stations. The software also includes an ADIF export function, enabling users to transfer logs to other general-purpose logging programs. The software's design emphasizes simplicity and ease of use, allowing for rapid on-the-spot training, as noted by users like W4CMB. It supports various operating systems, including Windows 98 through 8, and has been successfully run on Linux via _Wine_. Key usability enhancements include a "double-size" feature for improved readability and a "Space Mode" for quick field navigation. The version history indicates continuous development from 2001 to 2013, with significant additions like the real-time Field Day Map in 2003 and ADIF export in 2004, which allows for seamless integration with other logging platforms.
 -
 The resource provides specific information regarding amateur radio operations from various French islands, focusing on geographical and visual data. It includes photographic documentation of locations and detailed maps, which are crucial for operators planning DXpeditions or seeking to understand the unique challenges and opportunities presented by island activations. The content aims to support enthusiasts interested in rare grid squares and IOTA (Islands On The Air) awards. While currently under maintenance, the site's stated future enhancements include QSL card examples, which would offer practical insights into confirmation processes for these specific entities. The emphasis on French islands distinguishes it from more general DX resources, providing a concentrated body of information for a niche but active segment of the amateur radio community, particularly those pursuing island-specific operating awards.
 -
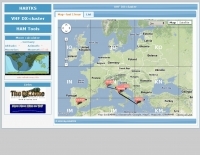 The HA8TKS VHF DXCluster is an essential online resource for amateur radio operators focusing on VHF and higher frequencies. This platform provides real-time information on DX spots, allowing users to track and engage in two-way radio communications effectively. The integrated map mash-up feature enhances the user experience by visually displaying the locations of DX stations, making it easier for operators to plan their contacts and optimize their antenna setups based on geographical data. In addition to the DXCluster functionality, the site offers various HAM tools, including a QRB calculator, which helps operators determine the distance to DX stations based on Maidenhead grid locators. The platform supports multiple modes of operation, including CW, SSB, RTTY, and digital modes like FT8 and JT65. With a user-friendly interface and comprehensive data, the HA8TKS VHF DXCluster is a valuable asset for both novice and experienced operators looking to enhance their DXing and contesting activities.
 -
 GoGreenSolar provides comprehensive solutions for **DIY solar panel systems**, catering to both homeowners and professionals seeking energy independence or reduced utility costs. Their offerings include a variety of solar kits such as Grid-Tie, Off-Grid, and Battery Backup configurations, designed to integrate seamlessly with existing utility infrastructure or provide complete autonomy in remote locations. Customers can select from Microinverter or String Inverter kits, along with essential components like **solar panels**, inverters, batteries, and racking systems, all curated from reputable brands known for efficiency and durability. The company emphasizes end-to-end support, from initial consultation and custom system design to providing easy-to-follow installation manuals. They offer financing options, including quick-approval loans with zero down payment, and a money-back guarantee if a solar permit is not approved. The platform also features a solar calculator and a questionnaire to help users determine the most suitable system for their specific energy requirements and property characteristics. GoGreenSolar aims to simplify the solar adoption process, enabling significant savings on energy bills and labor costs. Their approach focuses on empowering users to install their own systems with expert guidance, ensuring optimal performance and a secure energy future for homes and businesses.
 -
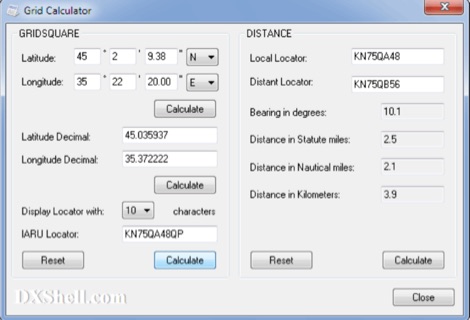 Grid Calculator allows you to calculate either a grid square locator or the latitude and longitude of a location. Grid Calculator can be used to calculate a Great Circle bearing and distance between two stations in statute miles, nautical miles, and kilometers.
 -
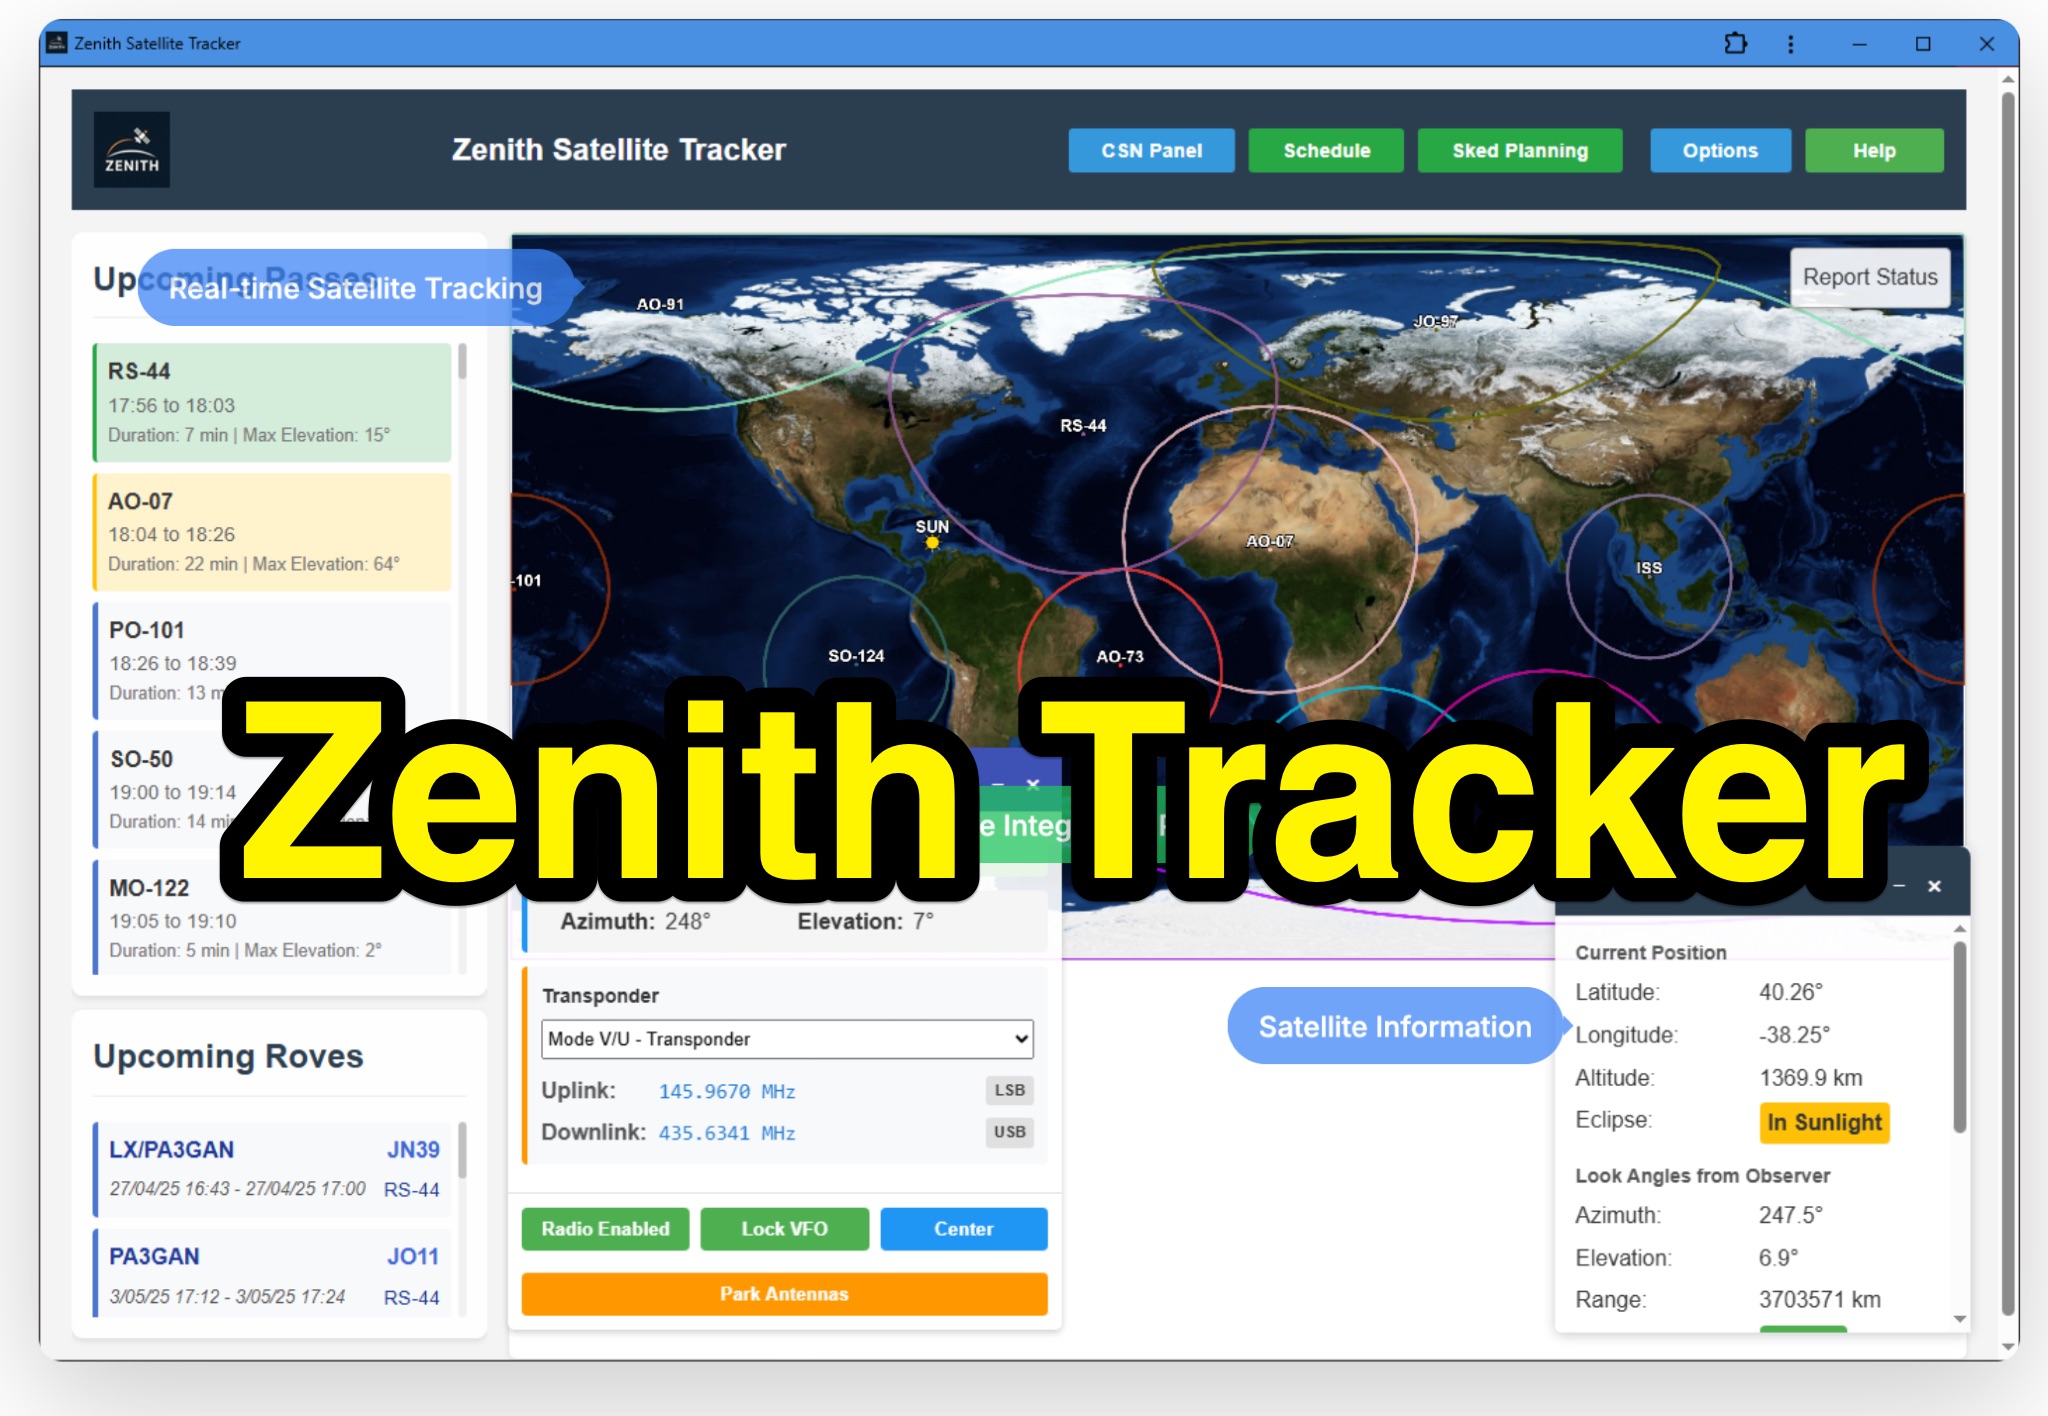 Zenith Tracker offers real-time satellite tracking, pass predictions, and radio hardware integration for ham radio operators. The platform includes an interactive world map showing satellite positions, footprints, and ground tracks, as well as a polar radar visualization for detailed pass analysis. Users can view upcoming passes, set filters, and receive notifications. Integration with CSN Technologies S.A.T Hardware and QTRigDoppler allows for automatic radio control, antenna tracking, and transponder management. The platform also offers APRS message interface, grid square-based location input, and API integration for rover activations. Zenith Tracker is recommended for both general users and those needing advanced hardware integration.
 -
 A real-time, responsive map view of APRS (Automatic Packet Reporting System) information, CWOP (Citizens Weather Observer Program), and other APRS-IS sources across the world. The N2RWE Real-time APRS Map leverages cutting-edge technologies and custom software to present a dynamic and user-friendly platform for visualizing Automatic Packet Reporting System (APRS) data. This web application aggregates real-time station locations from various public sources, offering a comprehensive view of APRS activity. It caters to both novice and experienced users by providing features like Maidenhead Grid maps, station lists, license plate searches, and advanced tools for geolocation, address lookup, and data analysis. Additionally, the platform integrates with Summits on the Air (SOTA) information, enhancing the experience for SOTA enthusiasts. By actively supporting the #APRSThursday net, the N2RWE Real-time APRS Map fosters a collaborative environment for the APRS community.
 -
 Spotty leverages Philip Gladstone’s pskreporter.info data, delivered via an MQTT broker by Tom Fanning (M0LTE), to offer a responsive web application for visualizing propagation. The Map View presents a default visualization (grid AA00 / callsign MY8CALL) and distinguishes signal types: small spots for signals heard by a location, large spots for transmissions from a location, and teardrop markers for transmissions from the monitored callsign. Clicking a spot reveals detailed signal data in an overlay. The application includes a Log View for raw spot data and a Settings tab for customization. Users can filter tracking by specific Callsign or Grid, with preferences saved to the browser. A notable feature is the Time to Live (TTL) setting, adjustable from the default 60 seconds, which controls spot visibility duration to manage map clutter during high-traffic periods. The tool provides a clear, logic-driven interface for real-time signal monitoring.
 -
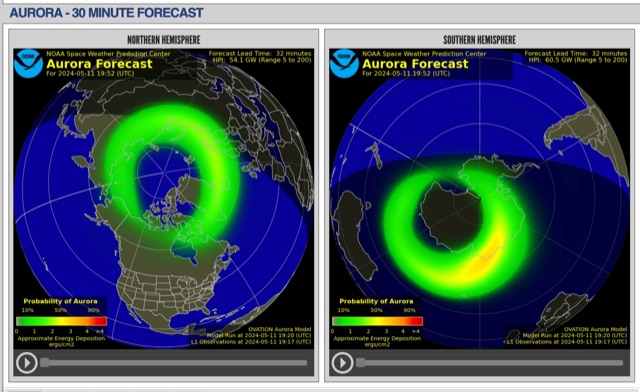 The short-term aurora forecast, based on the OVATION model, predicts aurora location and intensity 30 to 90 minutes ahead, aligning with solar wind travel time. Maps show aurora ovals in green, turning red for higher intensity. Aurora, visible after sunset or before sunrise, impacts technologies like radio communication, GPS, and power grids. It's a mesmerizing space weather spectacle, drawing travelers to the Arctic.
 -
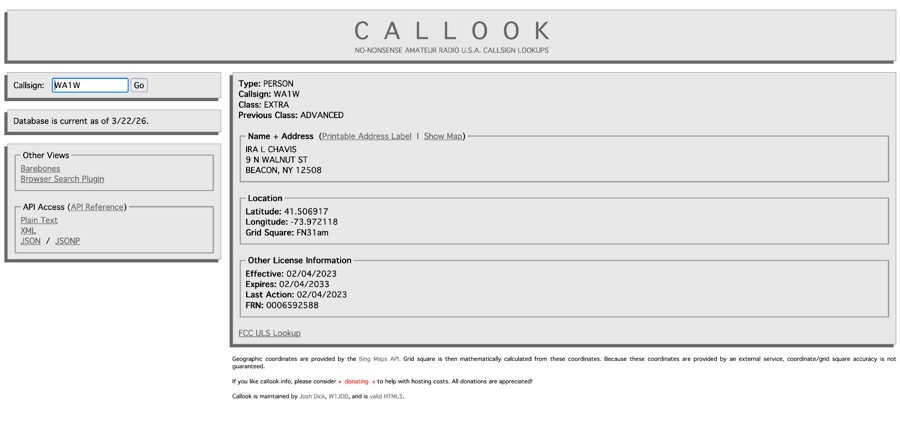 Callook provides a **USA amateur radio callsign lookup service** with data current as of March 25, 2026. The platform allows users to search for valid callsigns and retrieve detailed information, including geographic coordinates sourced from the Bing Maps API. A mathematically calculated **grid square** is derived from these coordinates, though accuracy is not guaranteed due to reliance on external services. The service supports multiple access methods, including a browser search plugin, direct API access with a reference, and plain text output for integration into other applications or scripts. This tool facilitates rapid identification of US amateur radio operators, offering an alternative to other callbook services. Its API access enables developers to integrate callsign lookup functionality into custom applications, streamlining data retrieval for logging software or contest management. The direct presentation of FCC data, combined with grid square calculation, assists DXers and contesters in verifying contact information and location details during on-air operations.
 -
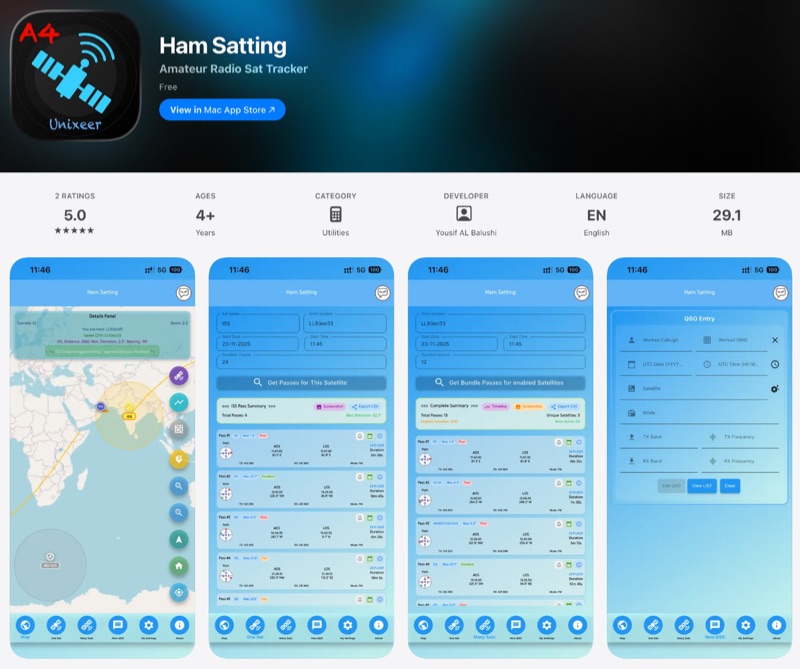 Ham Satting is a multi-platform application developed by A46UNX (Yousuf AL Balushi) for amateur radio satellite tracking. It offers real-time visualization of ISS and amateur satellites on an interactive map, along with detailed pass predictions including AOS, LOS, duration, azimuth, and elevation data. The app provides a timeline view for multiple passes and smart notifications for upcoming passes, with options to add to a calendar. Key features include QSO logging to a local database with filtering, searching, exporting, and emailing capabilities. It also supports location mapping to display QTH and current locations, tracking grid squares. A notable feature is the SSTV decoder, which supports Robot 36/72, Scottie, Martin, and PD modes with manual fine-tuning. Ham Satting is available for iOS, macOS, and Android, with BETA versions for Windows and Linux. The developer, A46UNX, started his ham radio journey in November 2024 as a member of The Royal Omani Amateur Radio Society (ROARS).