Search results
Query: smith chart matching net
Links: 3 | Categories: 0
-
 Accurately determining an antenna's feedpoint impedance is crucial for optimal performance, especially when experimenting with new designs or making adjustments. While SWR meters provide basic information, a full complex impedance measurement reveals the resistive and reactive components, which are essential for proper matching. Modern antenna analyzers, like the _Palstar ZM30_ or MFJ259B, simplify this task, but measurements taken through a transmission line require careful interpretation due to impedance transformation. This resource details a calibration method to precisely account for the effects of the feedline. It explains how a transmission line can significantly alter the measured impedance, illustrating this phenomenon with a Smith Chart example where an 80m antenna's [22 + j6] Ohms feedpoint impedance transforms to [82 + j45] Ohms after a 10m line. The guide demonstrates using a transmission line calculator applet, such as the one by W9CF, to reverse this transformation. It outlines the process of calibrating a specific length of RG174 coax, showing how an initial 26ft estimate was refined to **25.85ft** to accurately predict a known 22 Ohm load, significantly improving accuracy over uncalibrated results.
 -
 This graphics-intensive program reveals the load on the output of a matching-network, based on measurements of the components in that network. Adjust the network (tuner) for a flat input, measure or look up the network component values and you will immmediately see the R and jX values of the load on the network, presented as both a schematic with the component values and as a Smith Chart normalized to the specified system impedance.
 -
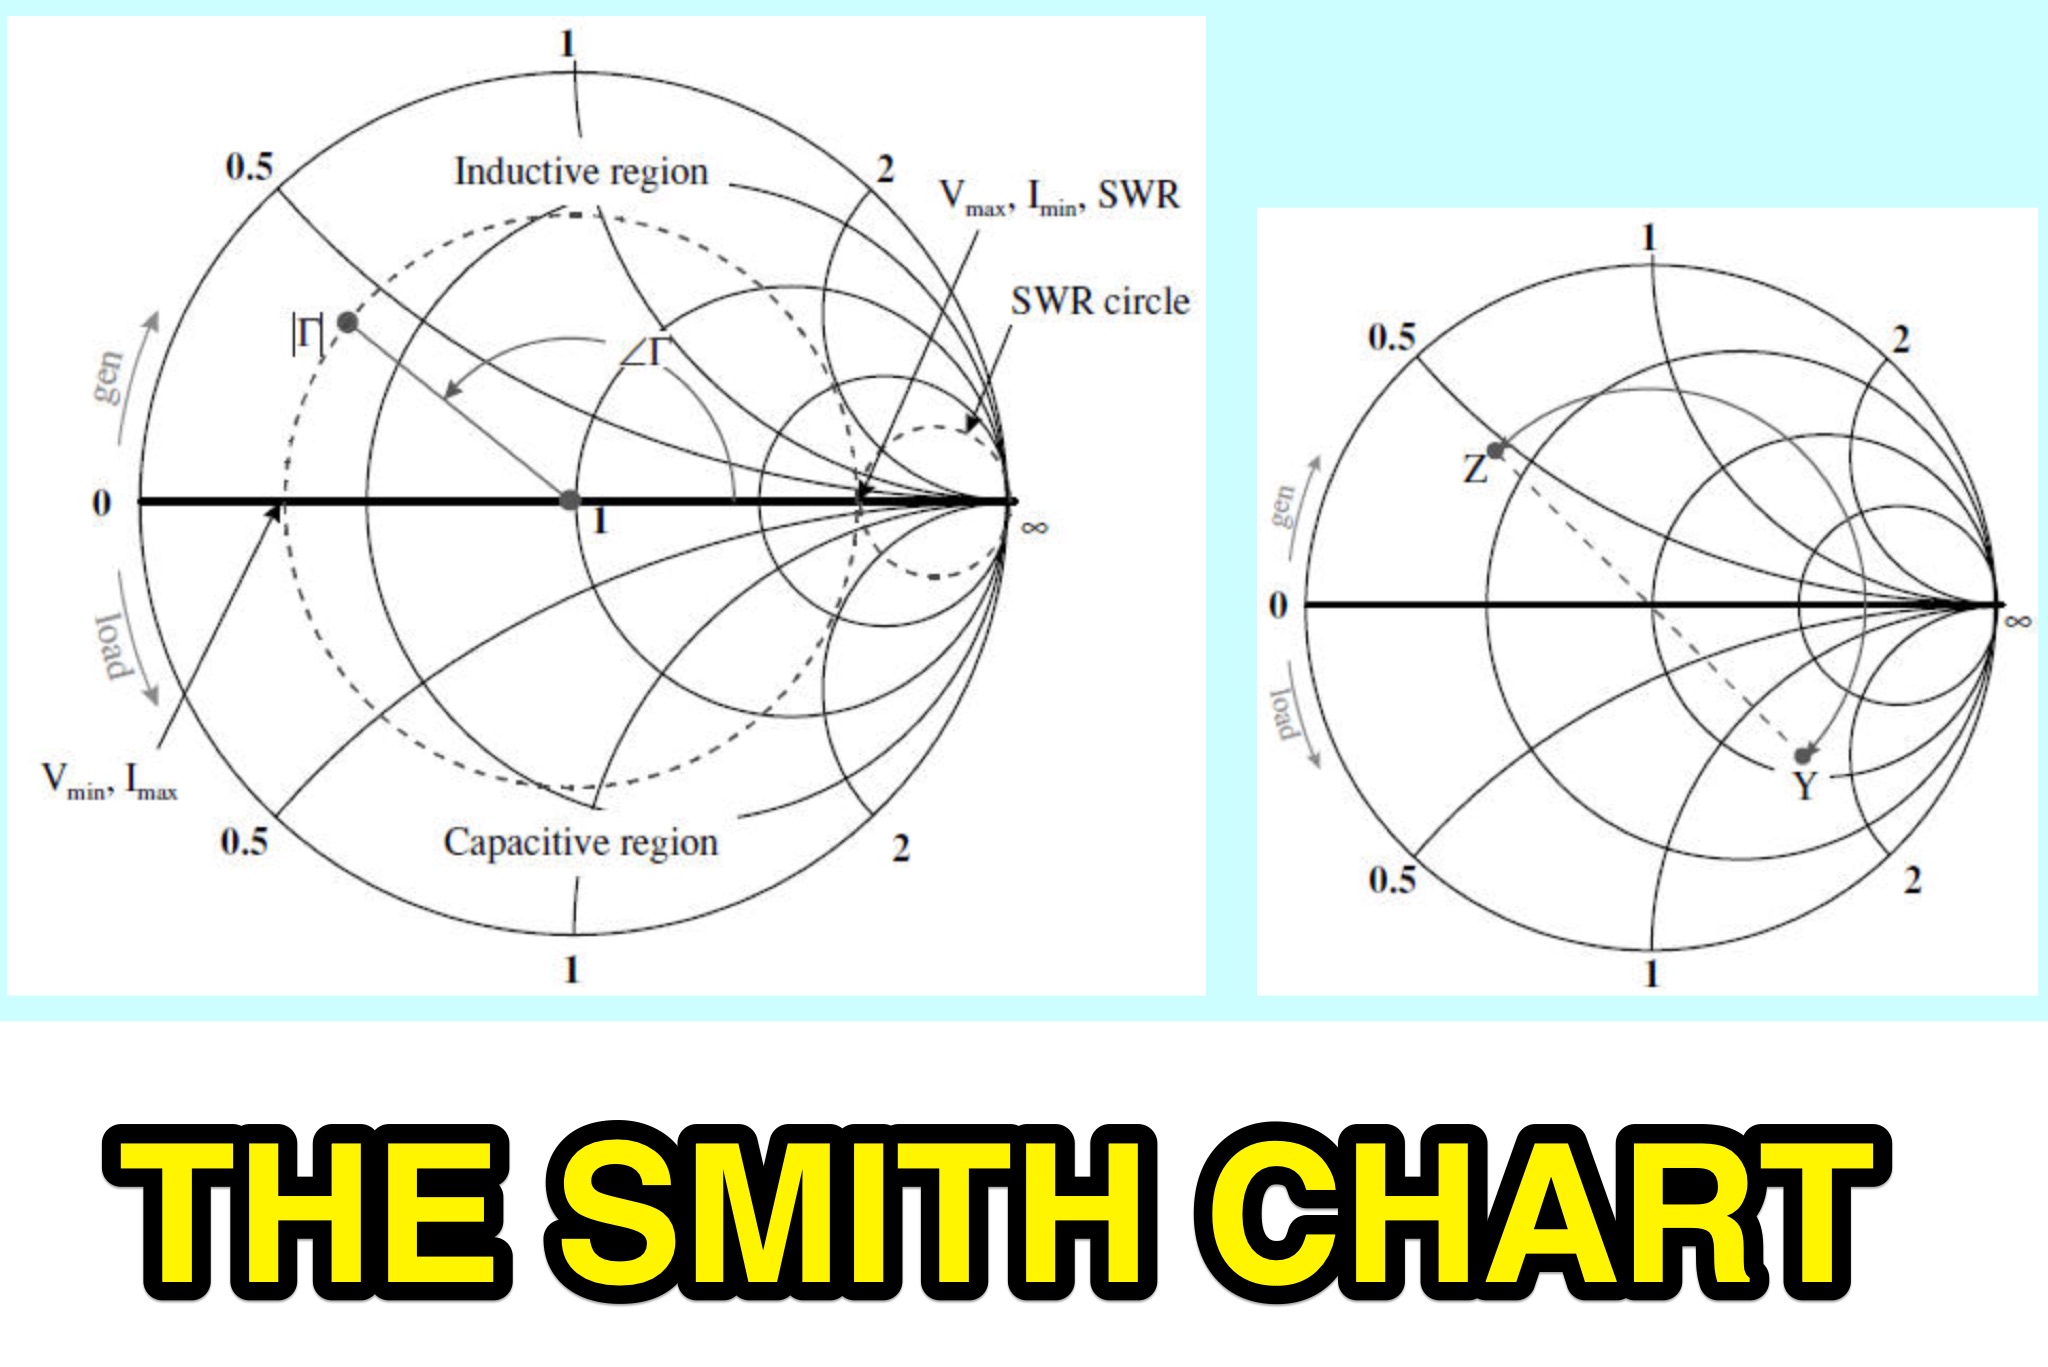 The Smith Chart, named after its inventor Phillip H. Smith, is a graphic tool used to solve transmission line problems in the field of ham radio operations. By using the Smith Chart, ham radio operators can determine the feed point impedance of an antenna, design impedance-matching networks, and optimize power transfer between a source and its load. The chart consists of resistance and reactance circles, providing a visual representation of complex mathematical relationships related to transmission line operations. Understanding and utilizing the Smith Chart is essential for hams looking to enhance the performance of their RF circuitry.