Search results
Query: wind strength
Links: 7 | Categories: 0
-
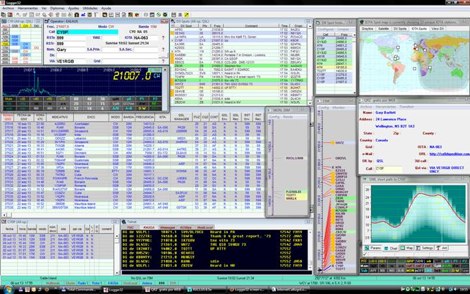 Logger32 is a well-established amateur radio logging program designed primarily for DXers who require a flexible and data-driven logging environment. The software maintains a comprehensive logbook database capable of handling large volumes of QSOs while offering detailed tracking of DXCC entities, awards, and band/mode statistics. One of the core strengths of Logger32 is its DX cluster integration. The program connects to telnet DX clusters and displays spots in real time, with filtering options by band, mode, country, or callsign. The cluster window can automatically highlight needed DXCC entities, band-fills, or new modes based on the operator’s log. Logger32 also provides rig control through CAT interfaces, supporting a wide range of transceivers via serial or USB connections. When properly configured, frequency and mode are automatically captured in the log entry window. The software supports digital mode integration through external applications and can exchange information using standard interfaces. Another important feature is its award tracking system, including DXCC, WAS, IOTA and other common amateur radio awards. The program calculates worked, confirmed, and needed entities with detailed reports. Logger32 supports ADIF import and export, allowing interoperability with other logging systems. It also includes QSL management, with tracking for bureau, direct, and electronic confirmations such as LoTW or eQSL when configured. Overall, Logger32 remains a technically capable logging solution focused on DX tracking, cluster awareness, and detailed statistical analysis of operating activity.
 -
 S Meter Lite is a no-cost program that displays your receiver's S Meter signal strength in a window by W8WWV
 -
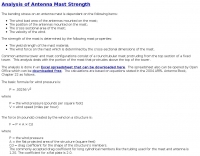 Calculations for determining the wind loading stress on an antenna mast. Link to a spreadsheet for calculating the mast bending stress based on wind speed and antenna cross sectional area.
 -
 This is a simple calculator for solving the antenna wire catenary between to end points given the design wind speed, mass per unit length of the wire, wire diameter and Gross Breaking Strength of the wire.
 -
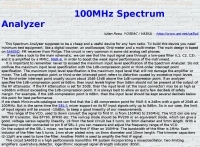 Constructing a functional spectrum analyzer for the 0-100 MHz range presents a significant challenge for radio amateurs, often requiring specialized components and careful calibration. This project details a homebrew spectrum analyzer design utilizing common integrated circuits like the _SA605D_ FM receiver IC and _MAR-6_ MMIC amplifiers, aiming for a cost-effective solution. The design incorporates a low-pass filter, RF amplification, a voltage-controlled oscillator (VCO) for downconversion, and multiple IF stages at 150 MHz and 10.7 MHz, with a resolution bandwidth (RBW) of 15 kHz. Critical components such as the _SBL-1_ mixer and varicap diodes are specified, alongside instructions for winding inductors and tuning filters. The analyzer's performance is discussed in terms of input level limitations, specifically the 1dB-compression point and third-order intercept point, to ensure accurate measurements and prevent component damage. The _SA605D_'s logarithmic Received Signal Strength Indicator (RSSI) output serves as the detector, driving the Y-input of an oscilloscope, while a _TL084_ op-amp generates the sweep signal for the X-input. Potential enhancements include adding a step attenuator, improving front-end filtering, and implementing switchable IF filters for variable RBW, allowing for greater versatility in analyzing RF signals.
 -
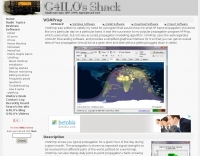 VOAProp shows you typical propagation for a given hour of the day during a given month. The propagation is shown as expected signal strengths to be received from different parts of the world, plotted on a world map. Windows freeware by G4ILO
 -
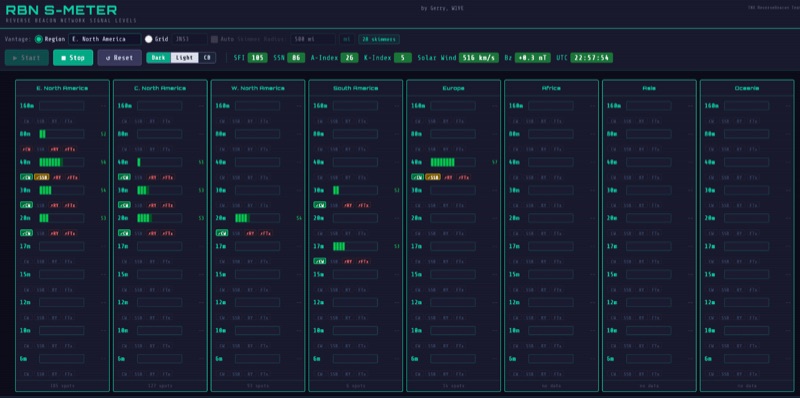 The RBN S-Meter visualizes real-time HF propagation data from the Reverse Beacon Network (RBN). It processes thousands of automated spots per hour, providing a real-time picture of active RF paths on HF bands. Users can set their vantage point using _Region Mode_ or _Grid Square Mode_. Region Mode allows selection from broad geographic areas like E. North America or Europe, while Grid Square Mode uses a Maidenhead grid square and radius for more precise data. The app displays eight region panels, each with horizontal bars for bands 160m through 6m, indicating signal strength with a color ramp from green to red. A dimmer trail shows peak hold values, and an S-unit readout provides additional detail. The app is a free web application accessible on any device, offering a practical tool for ham radio operators interested in CW, RTTY, and FT8 signals. It features a Progressive Web App installation option for enhanced usability on mobile and desktop platforms. Users can install it on Android, iOS, and Windows devices, providing a native app-like experience. The app replaces the previous Windows standalone executable, incorporating user feedback to improve features like grid square mode and automatic location detection.