Search results
Query: frequency charts
Links: 8 | Categories: 0
-
 Large aurtralian radio frequency charts collection
 -
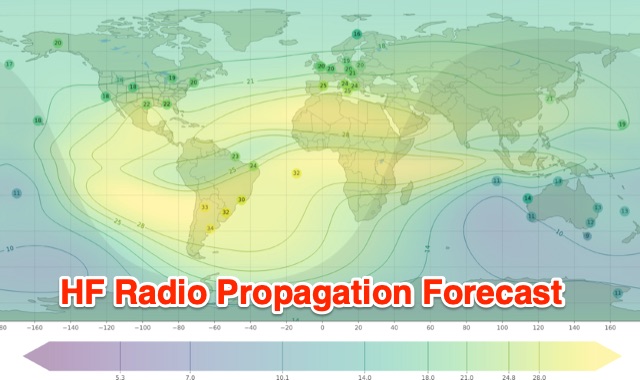
 Optimal Working Frequencies (MHz) for High Frequency (HF) / Shortwave Radio. By region, updated monthy.
 -
 Understanding high-frequency (HF) skywave propagation is crucial for amateur radio operators seeking to optimize long-distance communications. This resource details the fundamental principles of HF radio propagation, including the properties of electromagnetic waves, the characteristics of various HF bands, and distinct propagation modes such as skywave, ground wave, and line-of-sight. It places significant emphasis on the ionosphere's pivotal role in refracting HF waves, explaining how solar activity directly influences ionospheric conditions and, consequently, propagation paths. The resource integrates real-time monitoring capabilities, featuring dynamic charts and data from DX clusters, WSPRnet, and the Reverse Beacon Network, which allow users to track current band activity and propagation conditions globally. It also delves into advanced topics like Near Vertical Incidence Skywave (NVIS) and gray line propagation, providing insights into ionosonde data and various propagation prediction models. The site presents a detailed analysis of solar-terrestrial interactions, geomagnetic indices, and space weather phenomena, illustrating their direct impact on HF communication reliability. Practical tools and applications are highlighted, including real-time QSO planners, online Maximum Usable Frequency (MUF) maps, and alerts for solar flares or geomagnetic storms. The guide systematically breaks down complex concepts into accessible chapters, offering a structured approach to learning about ionospheric regions, diurnal and seasonal effects, and the interpretation of propagation indicators like foF2, MUF, and Lowest Usable Frequency (LUF). This makes it a robust reference for hams aiming to deepen their technical understanding and improve operational effectiveness.
 -
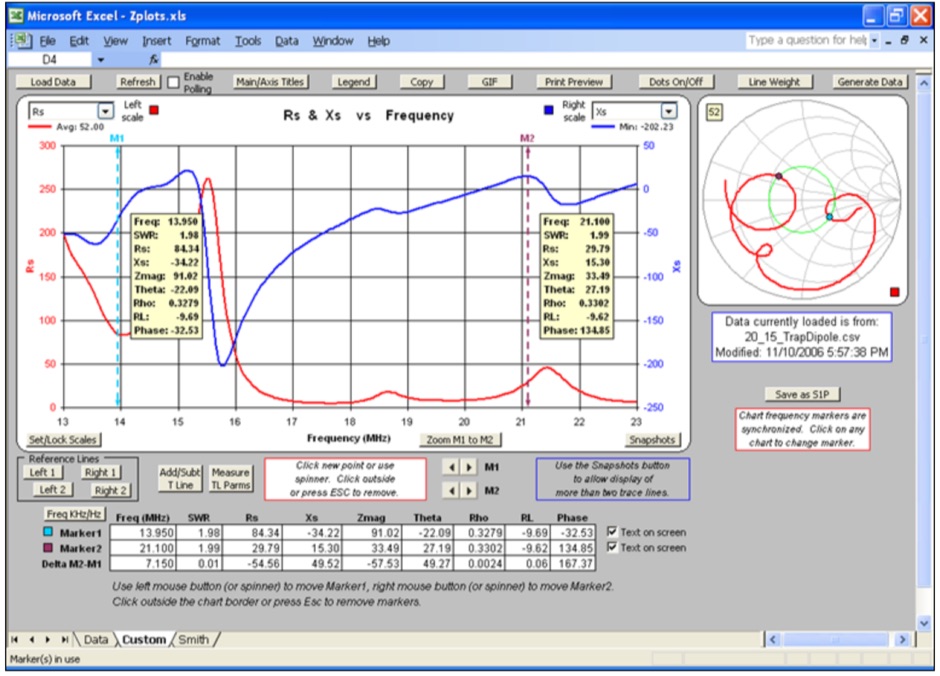 Zplots is an Excel application that allows you to plot impedance and related data obtained from a variety of sources. You can plot on both an XY chart and a Smith chart as well as view the data in tabular format. The XY chart can be customized with your choice of trace lines. Frequency (in MHz) is always shown on the X axis.
 -
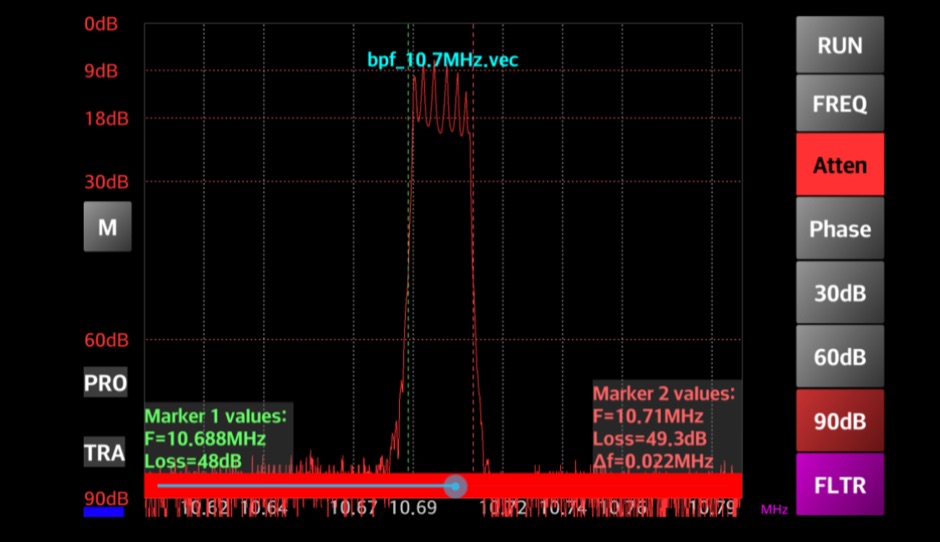 Enables Android users to operate various _miniVNA_ antenna analyzers via Bluetooth, USB, or Wi-Fi, providing a portable solution for RF measurements. The application supports full control over data acquisition, offering features like custom frequency range selection from 1 KHz to the VNA's full range, and automatic screen adaptation for diverse Android device resolutions. It facilitates intuitive, wizard-based calibration for both reflection and transmission modes, saving calibration data for different VNA types (Standard, Pro, Pro with Extender) to avoid repeated procedures. The software displays critical parameters such as SWR, |Z|, Return Loss, Phase, Rs, and |Xs| on 2-axis graphs or Smith charts, with multi-touch gestures for zoom and frequency shift. It includes a frequency generator mode with independent channels and attenuator control for the miniVNA Pro, along with a sweeper function. The cable data mode automatically calculates phase and loss, measures cable length from less than 1 meter to hundreds of meters, and includes a table of common coax cable velocity factors. An experimental X-tal mode measures resonance frequency, Rs, and Q. Data export options include CSV, ZPLOT, and S1P formats, with CSV import capability. The application also features an SM6ENG Audio mode for SWR tuning without visual reference and provides a miniVNA battery voltage indicator. It supports a wide frequency range, with the miniVNA Extender extending coverage up to **1500 MHz**. The application is compatible with Android version 2.2 and later, tested on devices like the _Galaxy TAB 7.7 P6800_.
 -
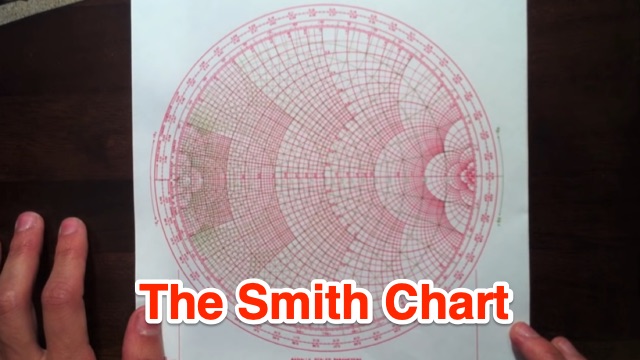 This tutorial introduces and explains Smith Charts, and then gives an introduction to impedance matching. Smith Chart is a tool to visualize the impedance of a transmission line and antenna system as a function of frequency.
 -
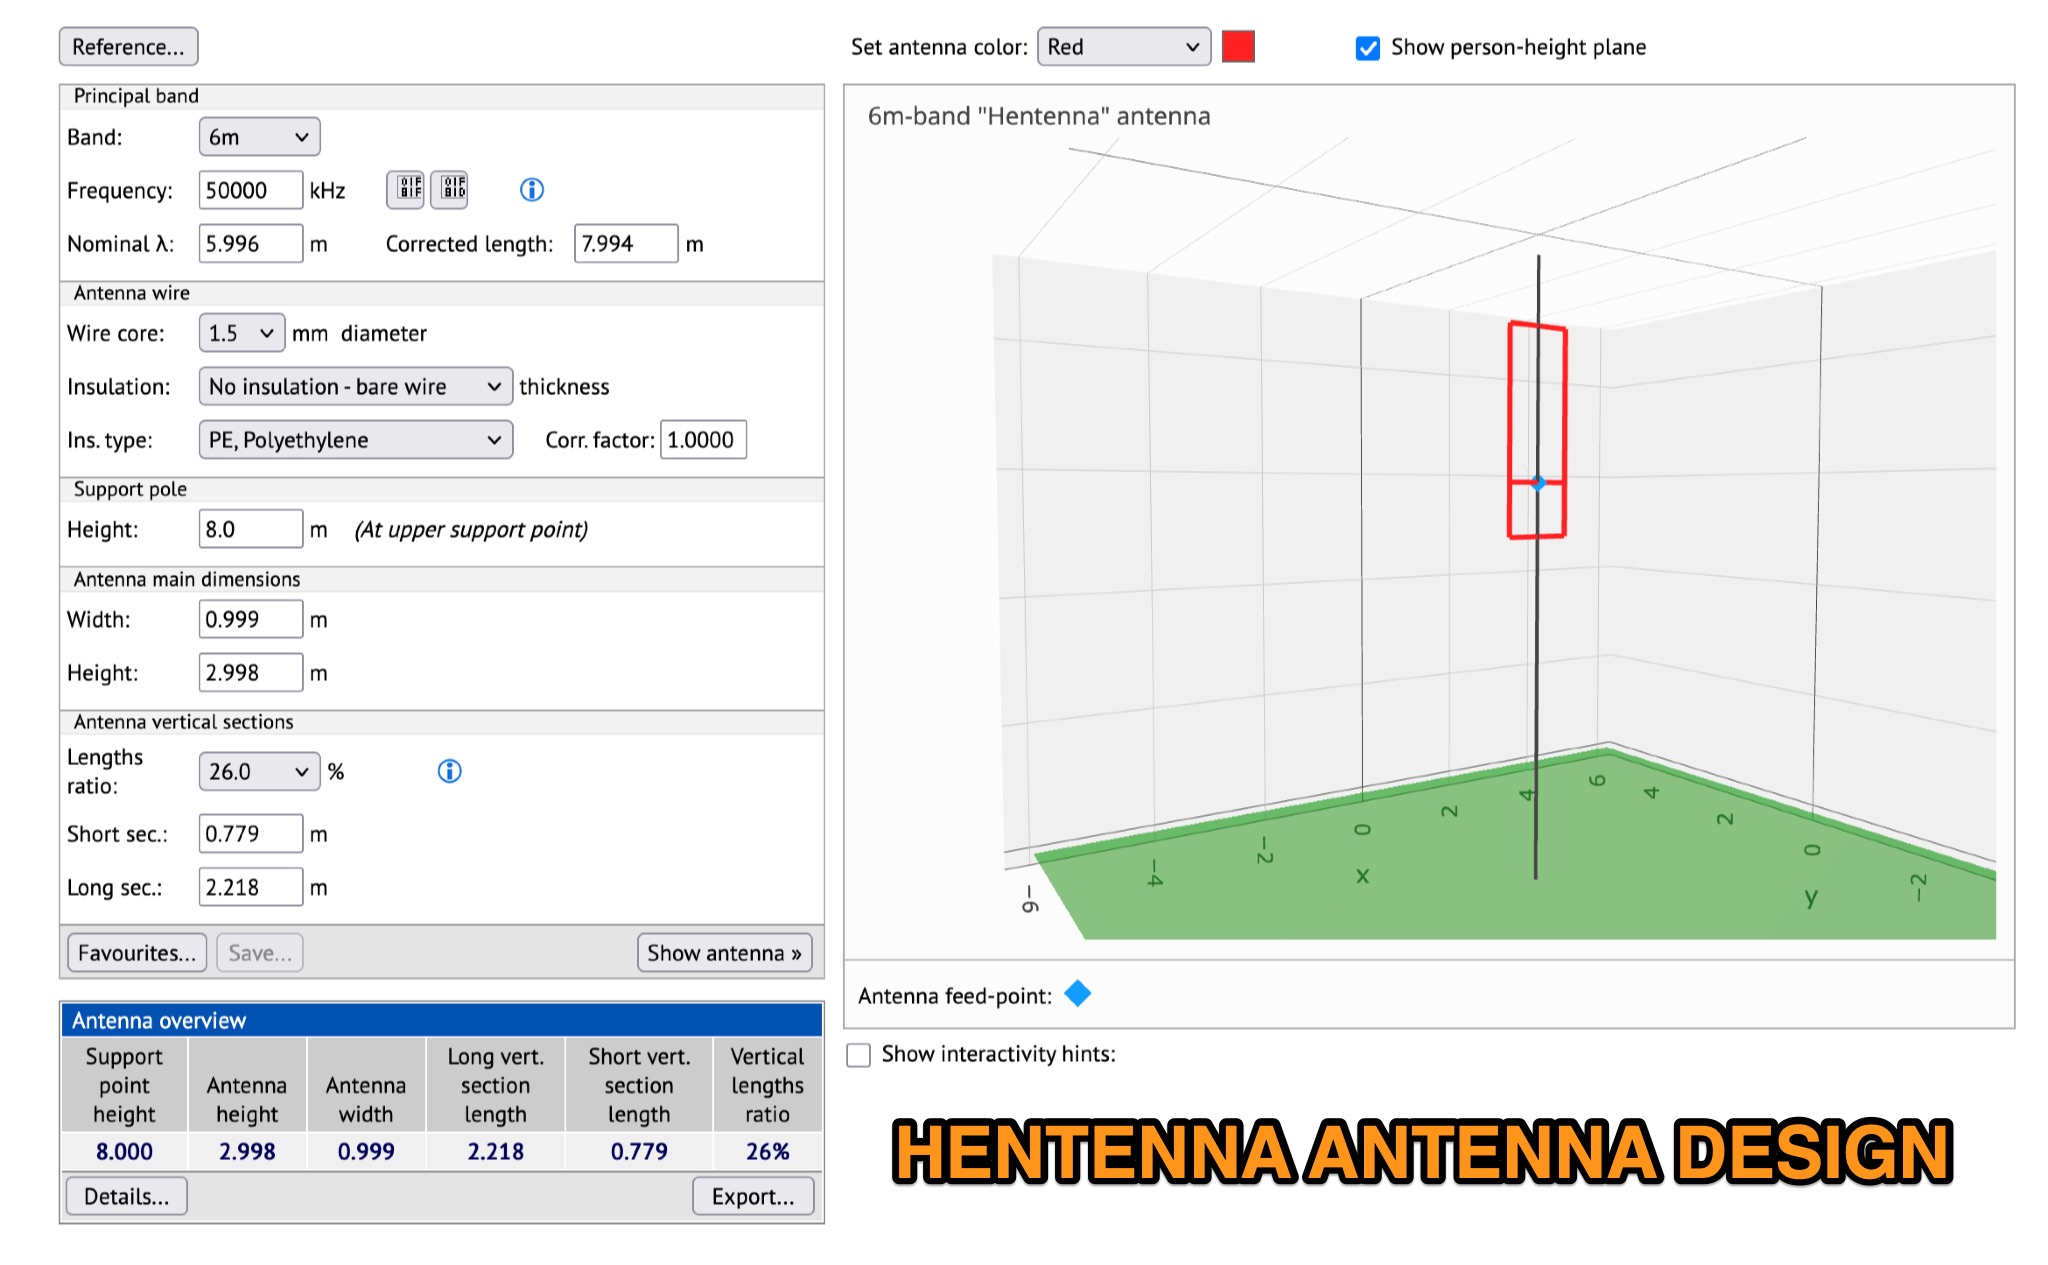 Learn how to design a Hentenna antenna, a portable asymmetrical double-loop antenna ideal for amateur HF or VHF bands. This page provides details on constructing and optimizing the antenna for maximum performance in DX communications. Discover how altering the antenna's vertical feed section can adjust the VSWR resonant frequency and how changing the support pole's position can alter the beam direction. Originally developed by Japanese 6-meter operators, the 'Hentenna' offers a unique design that allows for horizontal polarization when vertically oriented. Explore radiation patterns, VSWR charts, and antenna currents diagrams to optimize your antenna's performance for long-distance contacts.
 -
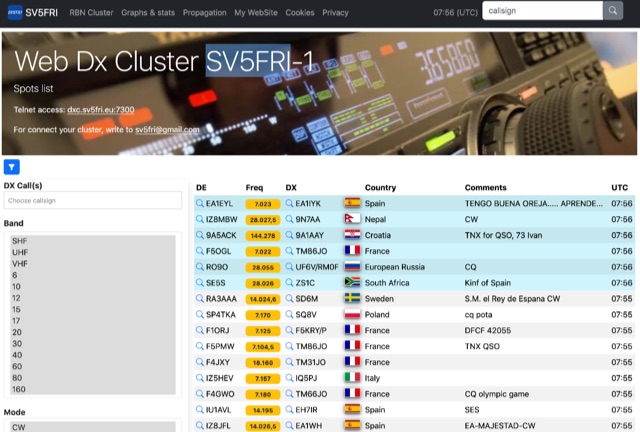 Operating a web-based DX cluster, this resource presents real-time amateur radio DX spots, facilitating contact logging and propagation analysis. It leverages the Spiderweb platform, offering users the ability to filter DX spots based on various criteria, including inclusion and exclusion rules. The interface integrates directly with QRZ.com for immediate callsign lookups, displaying flag icons for geographical context, and provides charts and statistics derived from spot data. Further enhancing its utility for DXers and contesters, the cluster includes direct links to MUF (Maximum Usable Frequency) maps and HamQSL solar condition reports. These external data sources provide critical propagation insights, assisting operators in making informed decisions about band selection and operating times. The service also offers Telnet access at dxc.sv5fri.eu:7300 for those preferring a command-line interface.