Search results
Query: data visualization
Links: 16 | Categories: 0
-
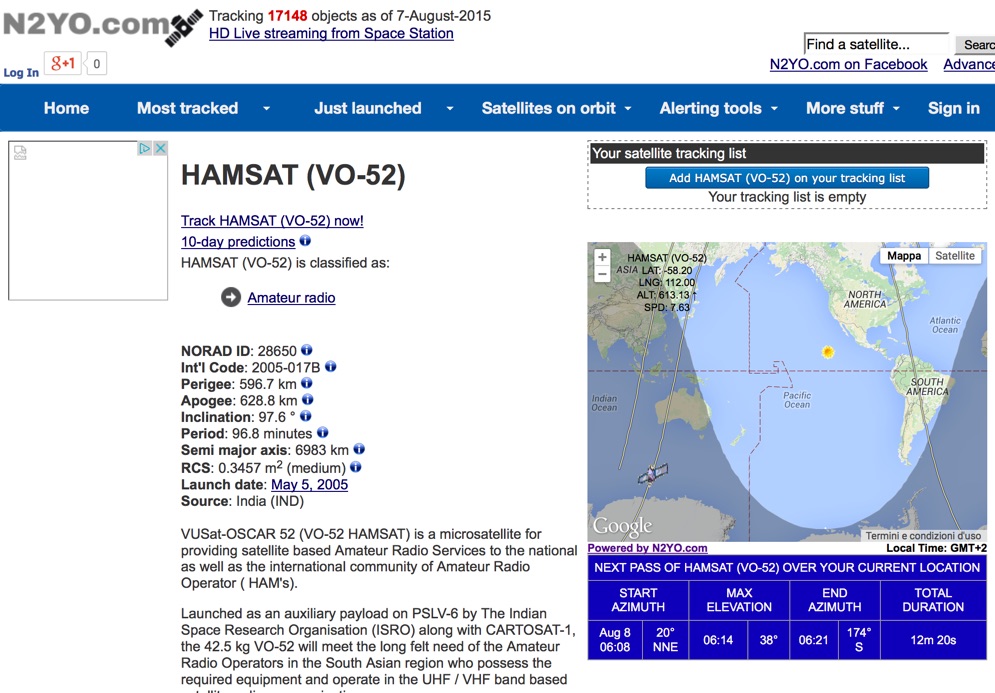 Select your favorite satellite and watch its trajectory on Google Maps in real time! Includes ISS tracking, Weather, Geostationary, GPS Military, and of course Amateur radio satellites. N2YO provides comprehensive real-time satellite tracking with particular emphasis on amateur radio satellites. The service offers precise pass predictions calculated for user-specific locations, displaying upcoming passes with azimuth, elevation, and duration data essential for ham operators planning satellite contacts. N2YO features dedicated tracking for amateur radio satellites including FM, linear transponder, and digital satellites, with frequency information and downlink/uplink details. The platform delivers live tracking visualizations on interactive maps, Doppler shift calculations, and automated email notifications for upcoming passes. This free resource integrates weather satellite tracking alongside NOAA imagery, making it invaluable for radio enthusiasts pursuing satellite communications.
 -
 Orbitron, a cardware application, provides robust satellite tracking capabilities for radio amateurs and visual observers alike. It leverages NORAD SGP4/SDP4 prediction models to accurately display satellite positions in real-time or simulation, accommodating up to 20,000 objects loaded from _TLE files_. The software includes an advanced search engine for satellite passes and _Iridium flares_, offering printable results for planning observations or QSO attempts. Sebastian Stoff's creation supports various visualization options, including a 'Nightlife' dark color scheme for nocturnal use, and integrates a database of cities and satellite frequencies. Users can synchronize their PC clock via NTP and update TLE data over HTTP, with ZIP support. The application also features rotor and radio control capabilities, either built-in or through user-defined drivers, which is particularly useful for automating antenna pointing during satellite passes. Its interface is designed for ease of use, making satellite tracking accessible even for beginners. First released in 2005, Orbitron 3.71 runs on Windows 9x/Me/2k/XP/2k3/Vista and can operate on Linux via _Wine emulation_, requiring minimal system resources. The software's precision relies on periodic TLE updates, especially for low-Earth orbit objects, to account for orbital decay and maneuvers by satellites like the ISS or Soyuz.
 -
 A Linux based FFT spectrum analyzer designed for time-frequency browsing and scientific data visualization. Oscilloscope waveform, statistical histogram, accumulated spectral trace,Weak Signal reception, continuos data logging, FFT Analyzer and specialized measurement windows.
 -
 Operating amateur radio satellites effectively requires precise knowledge of their orbital mechanics and pass times. Gpredict, a real-time satellite tracking and orbit prediction application, addresses this need by allowing operators to monitor numerous satellites simultaneously. It displays critical data such as position and pass details through various visualizations, including lists, tables, maps, and _polar plots_. Unlike many other satellite tracking programs, Gpredict introduces the concept of visualization modules. These modules enable users to group satellites and configure each group independently, offering unparalleled flexibility in how orbital data is presented. This modular approach supports tracking satellites from multiple observer locations concurrently, which is particularly useful for stations with diverse antenna setups or remote operations. Originally a GUI client for John Magliacane's _Predict_ program, Gpredict evolved to integrate its own tracking code for improved performance. The software is distributed under the GNU General Public License, ensuring it remains free and modifiable for the amateur radio community.
 -
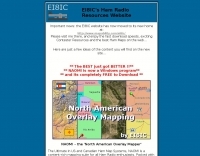 Over 47 full-screen maps are available within _NAOMI_ (North American Overlay Mapper), a free Windows program designed for US and Canadian amateur radio enthusiasts. This mapping suite includes 9 backgrounds such as CQ Zones, ITU Zones, and ARRL Sections, along with 16 foreground layers like Counties, Areacodes, and Grid Locators. Users can calculate distances and bearings, track real-time mouse positions with continuous Grid-Locator data, and integrate with APRS for live station tracking via the FindU database. For a global perspective, the _Global Overlay Mapper_ (GOM) provides a world map, 8 continental maps, and 29 sub-continental maps, all with 12 active layers including Country Outlines, CQ/ITU Zones, and Prefix information. Both NAOMI and GOM offer feature-locate systems to jump to positions based on prefixes, capital cities, or Grid Locators, and provide customized beam headings and distance displays. The site also features _LogView_, a post-contest log visualization tool that analyzes Cabrillo-format logs by plotting QSOs on maps, supporting over 30 major contests like CQWW and ARRL DX, and allowing comparison with published results.
 -
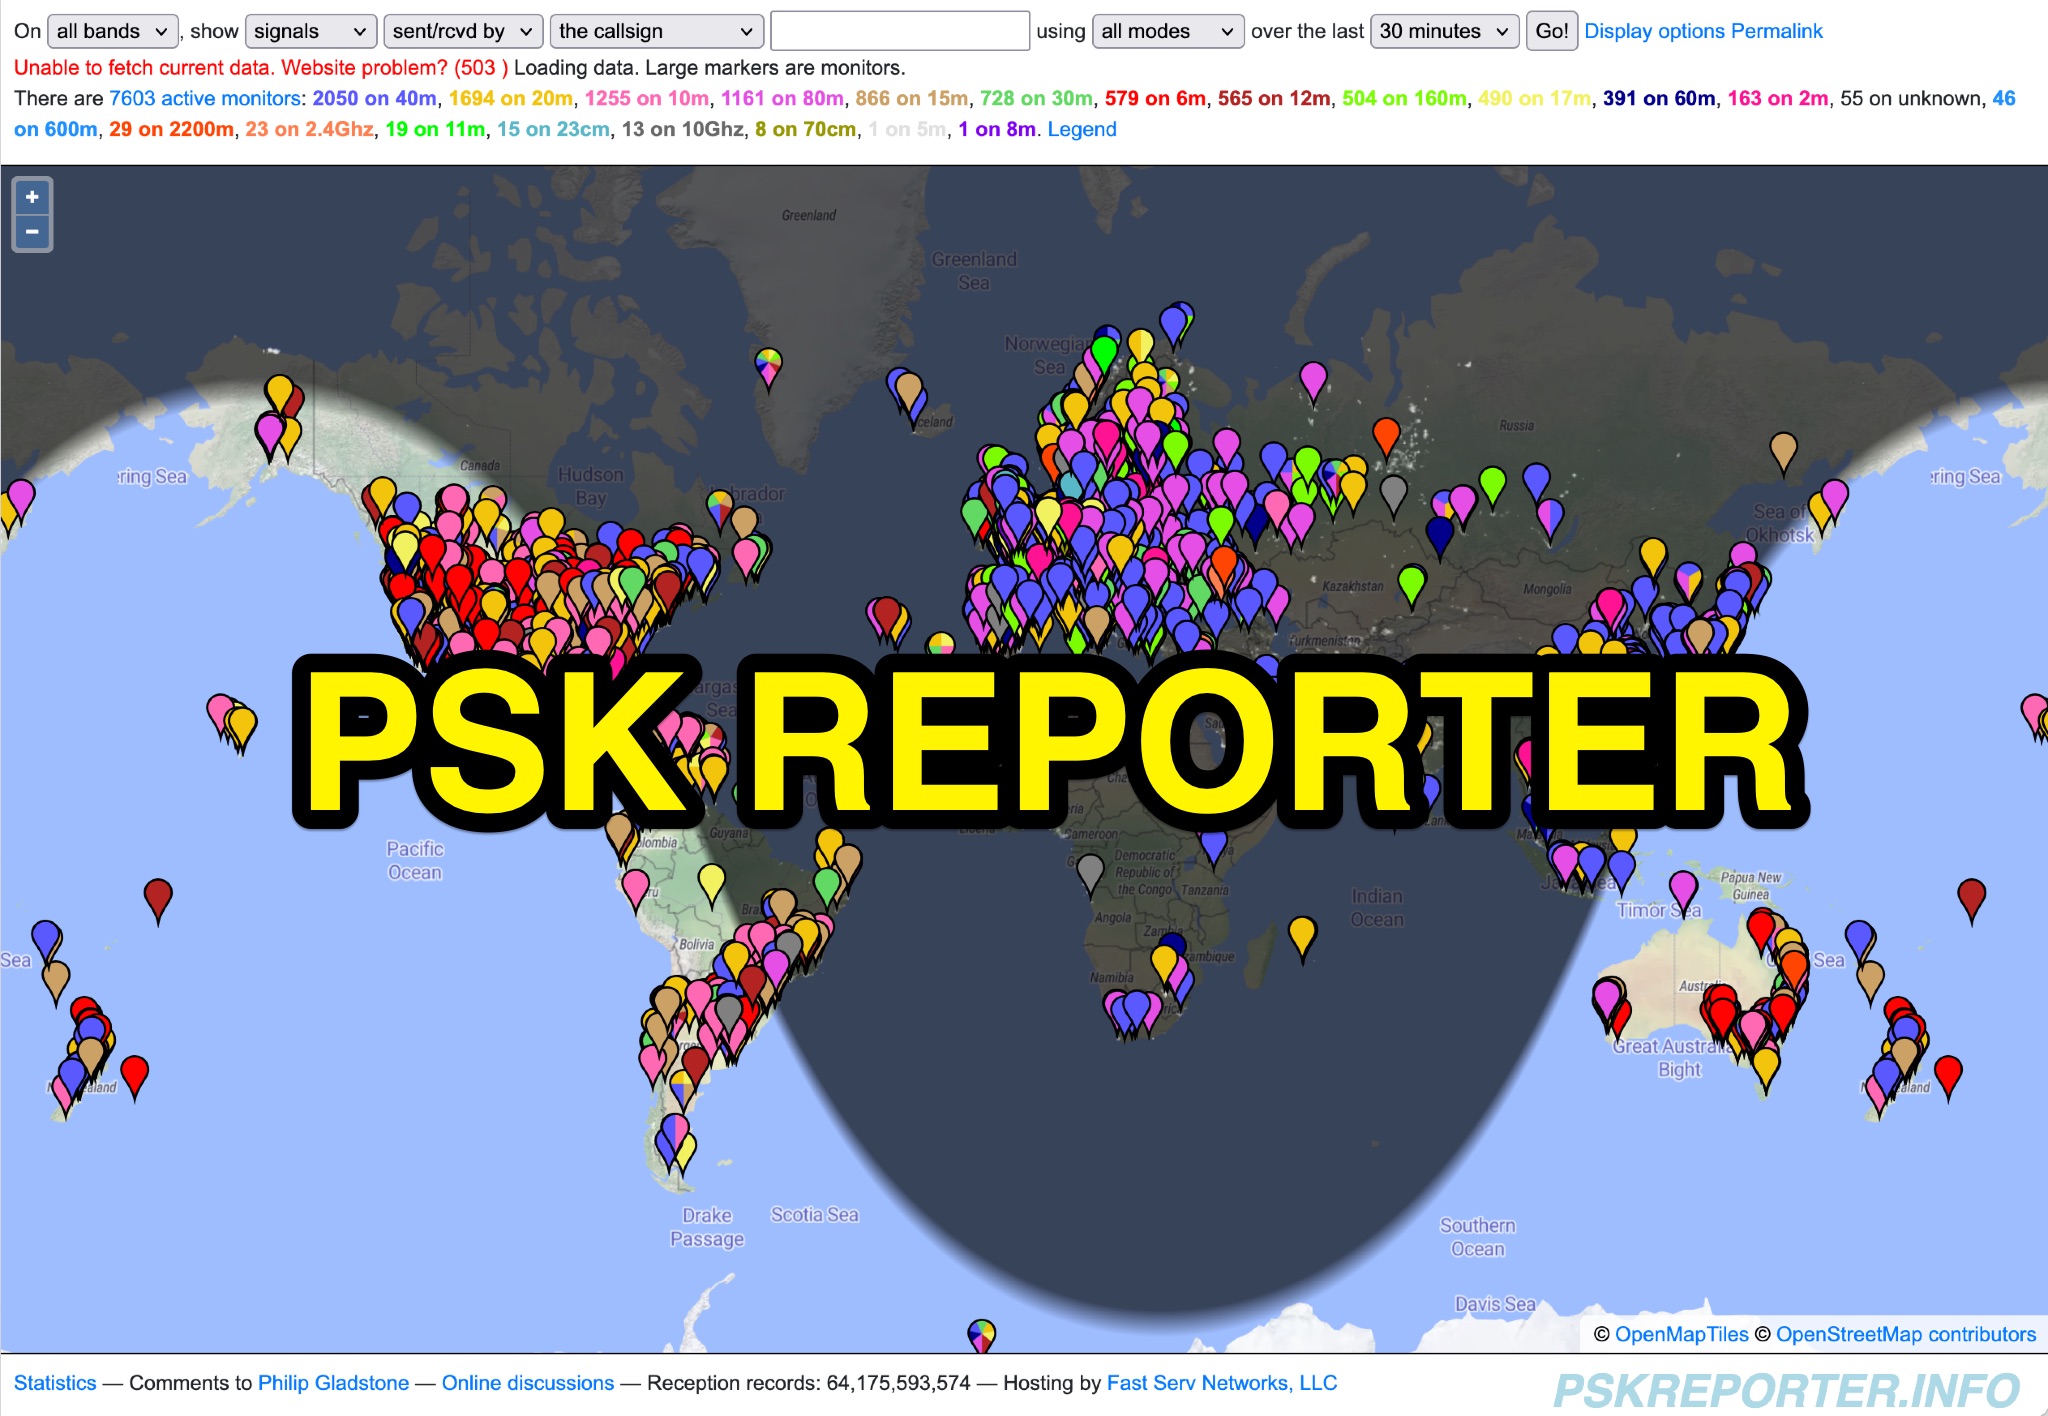 PSK Reporter provides a real-time visualization of amateur radio digital mode reception reports, aggregating data from a global network of monitoring stations. This platform is particularly useful for operators utilizing modes such as FT8, FT4, and PSK, allowing them to observe signal propagation paths and assess their station's reach. The interactive maps display reception reports, enabling hams to analyze band conditions and optimize antenna performance for various frequencies and times of day, aiding in understanding ionospheric conditions. Operators can filter reports by callsign, band, mode, and time, gaining insights into specific propagation events or evaluating the effectiveness of their transmit setup. The data collected helps in predicting optimal operating windows for DX contacts across various digital modes. Philip Gladstone is the contact person for comments and discussions regarding the system.
 -
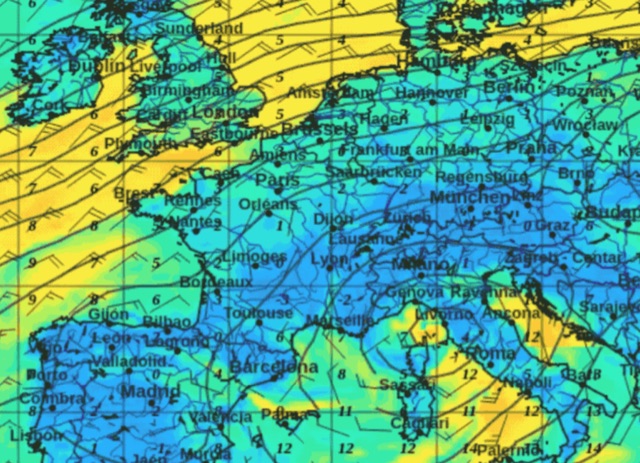 If you want to have a closer look at the weather, you can download software and visually display data.
 -
 Time Mapper UHD is a versatile mapping and time visualization program offering multi-satellite viewing with frequency display and unique country-pairs for PskReporter data. It features live feeds from logging programs and can plot ADIF files. Ideal for schools, offices, or amateur radio stations, it provides customizable 4K or HD world clock displays with over 60 map layers, including ham radio zones and natural features. The program supports various time functions and can import logs for detailed analysis. It runs on Windows 10 or 11 and offers a 30-day free trial.
 -
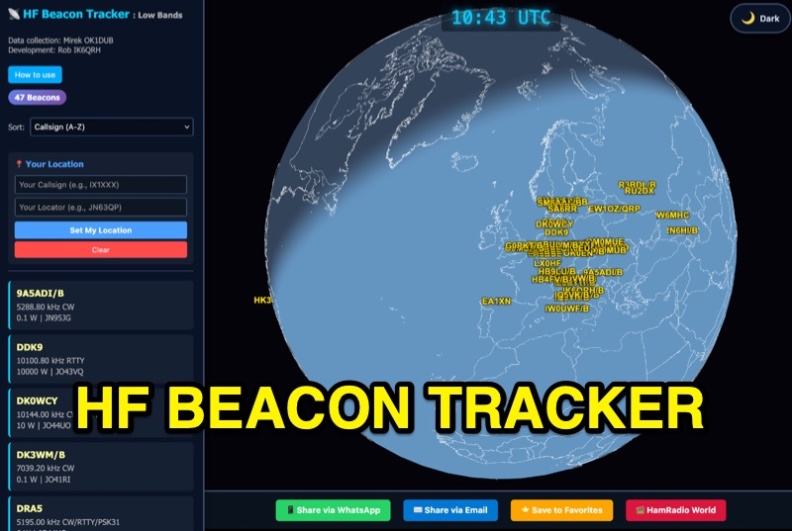 The HF Beacon Tracker is an advanced interactive tool designed for DXers and ham radio opoerators in general to monitor active beacons operating below 14 MHz. Built upon a high-fidelity 3D Earth globe, the application provides a spatial perspective on signal paths by integrating real-time environmental data with a comprehensive beacon database curated by Mirek OK1DUB. Beacons are plotted using precise Maidenhead locators and feature a real-time day/night terminator overlay to help operators identify Gray Line propagation opportunities. With a single click, users can calculate the exact distance from their own QTH to any beacon, visualized via an animated Great-Circle Path arc on the globe surface. To enhance its diagnostic capabilities, the tool seamlessly integrates with PSK Reporter, allowing users to right-click CW beacons to instantly fetch current reception reports and signal strength data. The interface is fully optimized with a mobile-responsive design, smooth globe rotation, and togglable Dark/Light themes suitable for any shack environment. Whether you are performing antenna gain tests, conducting ionospheric research, or simply hunting for band openings, the HF Beacon Tracker transforms raw database information into an intuitive, visual diagnostic suite. It serves as an essential asset for any operator looking to master HF band conditions.
 -
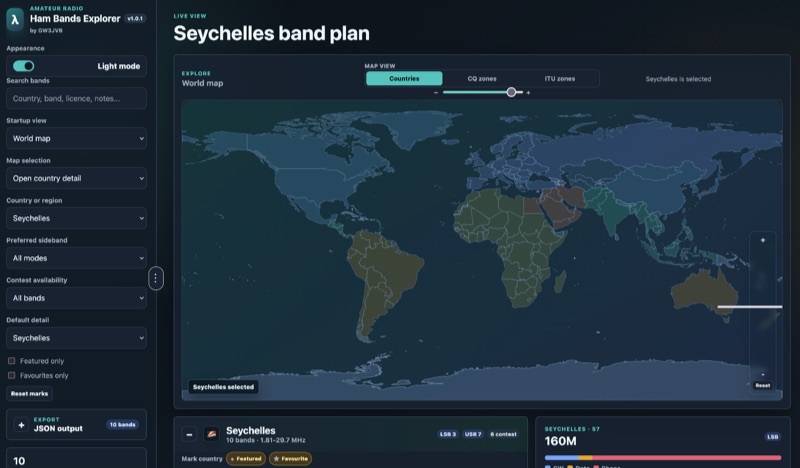 Presents an interactive **Ham Bands Explorer** web application, offering a live view of all amateur radio bands overlaid on a world map. This resource displays **CQ zones** and **ITU zones**, with geographical data sourced from HB9HIL/hamradio-zones-geojson under an MIT license. The interface provides a dynamic visualization of global band conditions, enabling operators to observe activity patterns across different regions. Users can select individual countries to retrieve and display their specific band plans, with frequency coverage details loaded from CountryData.json. The tool indicates 100% frequency coverage, ensuring comprehensive data presentation for selected regions. This functionality supports detailed analysis of national regulatory variations within the amateur spectrum. The application integrates both a map view and a live view, facilitating real-time monitoring and geographical context for band usage. It serves as a practical reference for understanding international amateur radio regulations and visualizing propagation characteristics across various frequency allocations.
 -
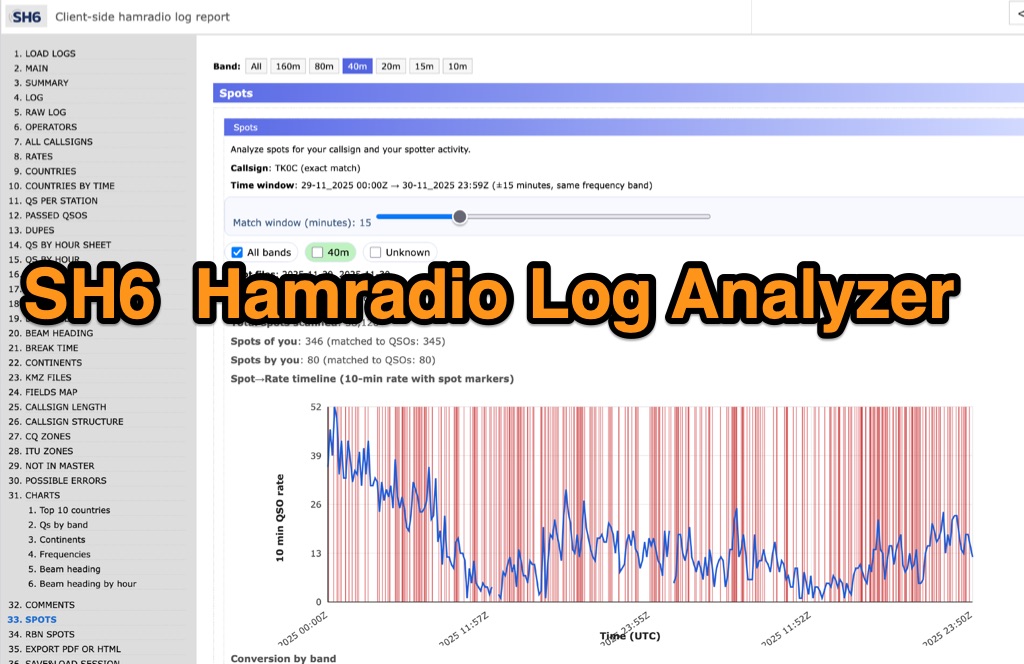 SH6 is a versatile, browser-based utility designed for the detailed analysis and visualization of amateur radio contest logs. Supporting standard formats such as Cabrillo and ADIF, the tool allows operators to upload personal files via drag-and-drop or access a searchable public archive containing over one million logs. Key capabilities include comprehensive performance metrics, offering summaries of band breakdowns, QSO rates, and beam headings. Furthermore, SH6 provides advanced geographic visualization through interactive maps, analyzing contacts by country, zone, and continent. A standout feature is the side-by-side comparison mode, enabling users to contrast two distinct logs for strategic assessment. SH6 transforms raw log data into actionable insights regarding operator performance without requiring software installation.
 -
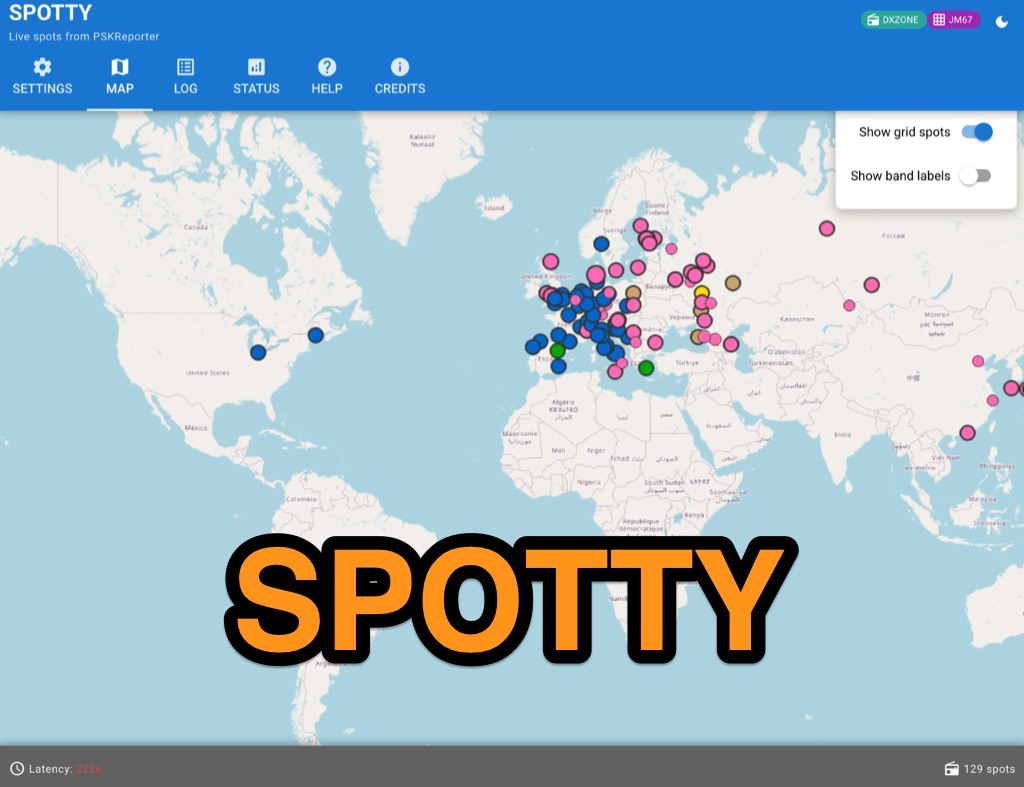 Spotty leverages Philip Gladstone’s pskreporter.info data, delivered via an MQTT broker by Tom Fanning (M0LTE), to offer a responsive web application for visualizing propagation. The Map View presents a default visualization (grid AA00 / callsign MY8CALL) and distinguishes signal types: small spots for signals heard by a location, large spots for transmissions from a location, and teardrop markers for transmissions from the monitored callsign. Clicking a spot reveals detailed signal data in an overlay. The application includes a Log View for raw spot data and a Settings tab for customization. Users can filter tracking by specific Callsign or Grid, with preferences saved to the browser. A notable feature is the Time to Live (TTL) setting, adjustable from the default 60 seconds, which controls spot visibility duration to manage map clutter during high-traffic periods. The tool provides a clear, logic-driven interface for real-time signal monitoring.
 -
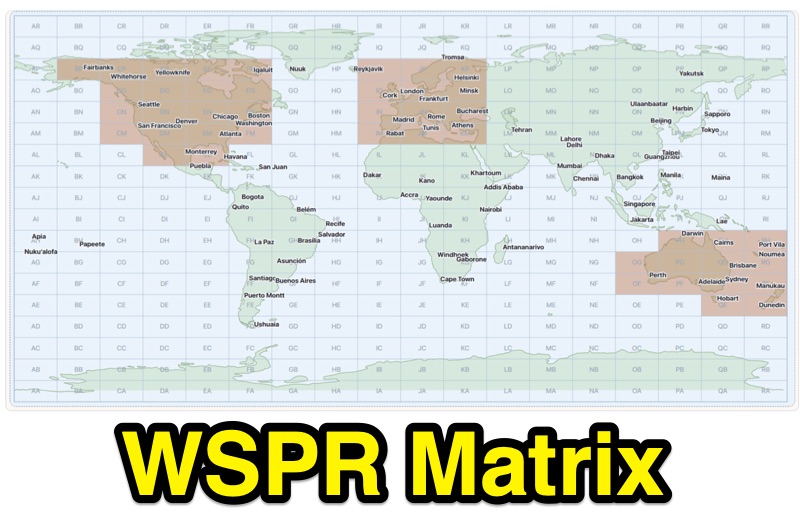 Demonstrates WSPR propagation activity, presenting observed data by reporter, band, UTC time, local time, and user-selected global destination areas. The application allows users to analyze WSPR spots from a live data server or import saved WSPRnet query files, bypassing the 10,000-row download limit by collecting individual band files for busy bands. Users can configure band preferences and destination modes, choosing between city radius or Maidenhead map grids for filtering path destinations. The interface provides options to start current-day live collection, a 7-day continuous archive, or load previously saved data to build the propagation matrix. Diagnostic information and archive history are accessible, alongside map setup controls for grid contrast and visibility. The tool supports both Path 1 and Path 2 map destinations, enabling detailed analysis of WSPR signal paths.
 -
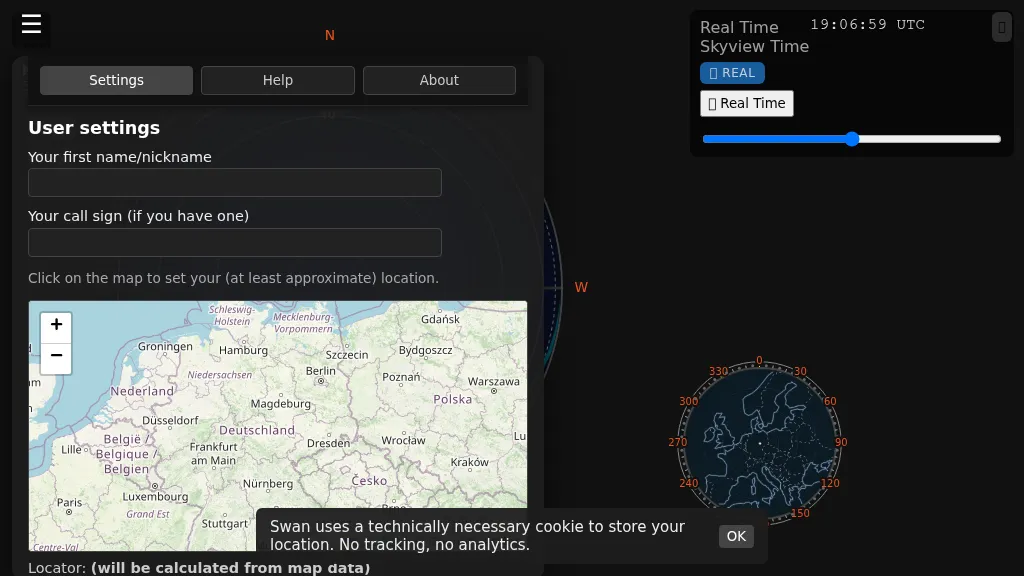 Swan provides a real-time, browser-based visualization of **meteor radiants** and forward scatter corridors, serving as a modern re-imagining of the classic Virgo meteor sky visualization tool. It displays meteor radiant and radio scatter geometry, offering both visual and numerical skyview data. The tool updates in real-time, showing current sky conditions and allowing users to pause and review specific timeframes for analysis of meteor shower activity and potential radio propagation paths. This enables operators to identify optimal windows for **meteor scatter** contacts. Operators can utilize Swan to predict and optimize their meteor scatter DX attempts by understanding the geometry between their station, meteor radiants, and potential receive stations. The interface presents critical data points for assessing forward scatter opportunities, which is crucial for maximizing short-duration meteor burst communications. By observing the real-time skyview, users can correlate meteor activity with observed signal enhancements, refining their operating strategies for specific meteor showers or random meteor pings.
 -
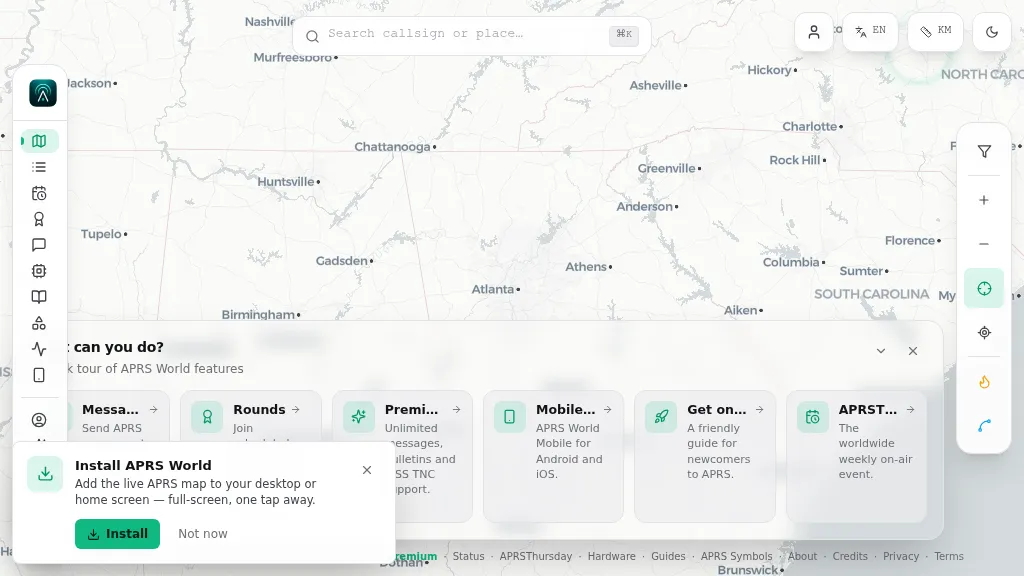 Operating on the Automatic Packet Reporting System (APRS) network, this platform provides a real-time, visual representation of amateur radio stations globally. Users can track callsigns, locate nearby stations, and even send APRS messages directly from a web browser, all without requiring a login. The system integrates live APRS-IS data, presenting it in an intuitive, map-based interface that supports 11 different languages, making it accessible to a broad international audience. Beyond basic station tracking, the platform offers detailed per-station pages, including historical weather data and telemetry logs. This functionality extends to companion Android and iOS applications, which incorporate an RF / KISS-TNC mode, allowing mobile devices to interface directly with APRS via radio. My own field experience with similar APRS visualization tools confirms the utility of such a resource for situational awareness during events or simply monitoring local and regional ham radio activity. The inclusion of weather and telemetry history adds significant value for those interested in environmental data or remote station performance.
 -
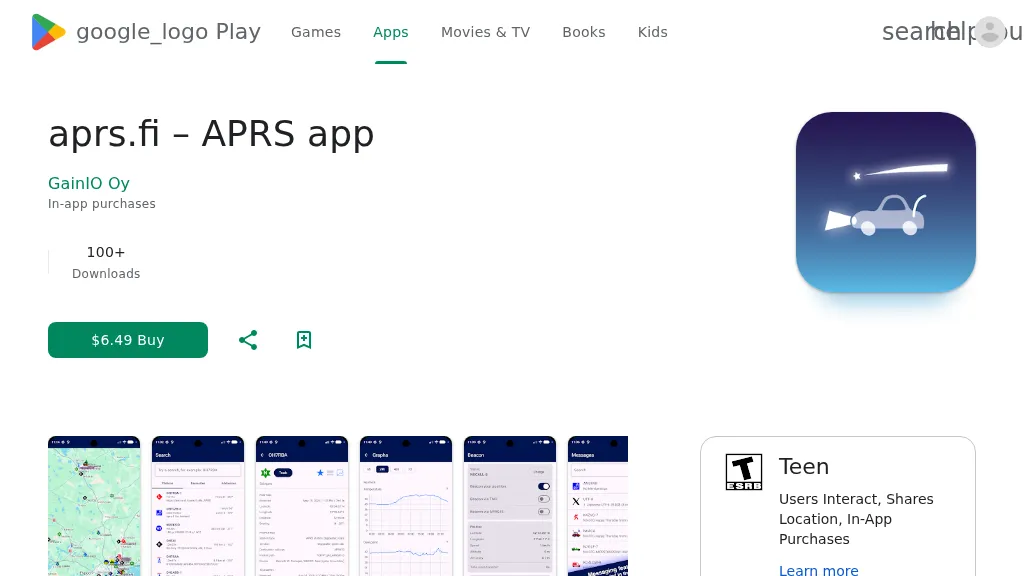 The aprs.fi Android application offers immediate, real-time access to APRS position information, weather reports, and telemetry graphs, allowing users to zoom and browse stations globally without delay. It includes features like callsign and address search with history, multi-station tracking, and map filtering for elements such as weather stations and AIS targets. The app also supports KML and GeoJSON overlay files for enhanced map visualization. Users can beacon their position directly to aprs.fi or connect wirelessly to a Bluetooth, BLE, WiFi, or USB-attached TNC for receiving and transmitting position beacons without an internet connection. The application runs on the robust and fast aprs.fi database, providing _Dark Mode_ support for improved ergonomics in low-light conditions and high-resolution graphics for modern displays, including the full APRS symbol set. While the core application is a one-time purchase, some advanced functionalities, such as APRS text messaging, a high-performance software DSP modem, and _APRS-IS_ beaconing with up to **10 callsign profiles**, require an additional "Extra Features" subscription. This subscription also unlocks RX iGate functionality and extended time ranges for map and graph views, expanding its utility for serious APRS operators.