Search results
Query: PSK Reporter
Links: 28 | Categories: 0
-
 DXMaps.com presents a dynamic, real-time mapping service for amateur radio DX spots, integrating data from traditional DX clusters, _PSK Reporter_, and WSPR networks. The platform visually plots global QSO and SWL activity, enabling users to observe propagation conditions across various bands, from 2200m to >450 MHz. It offers distinct overlays such as the magnetic equator, gray line, moon footprint for EME, and VOACAP propagation predictions, providing a comprehensive view of radio wave behavior. The service allows granular filtering of displayed spots, including options to show only DX-Cluster data, PSK Reporter activity, or WSPR signals. Users can refine the map view by selecting specific bands (e.g., 160m, 20m, 6m, 2m), limiting spots to the last 15 minutes, or displaying only contacts exceeding **2600 km**. Additional features include the ability to toggle grid squares, aurora forecasts, and various amateur radio zones (CQ, ITU). Distinctively, the resource updates automatically every minute, ensuring current propagation intelligence without manual refresh. It also supports specialized views for EME, ionospheric scatter, and aircraft scatter, alongside FM DX and APRS activity. The platform emphasizes the importance of accurate locator information in DX spots to enhance data quality and offers a user manual and FAQ for guidance.
 -
 VQLog 3.1 - 782 is a shareware logbook program designed for Windows operating systems (95, 98, NT, 2000, ME, XP, Vista, 7, 10, or later), supporting resolutions of 800x600 or higher. It can also operate on macOS and Linux via virtualization software like Virtual PC for MAC, Oracle VirtualBox, or VMware. The software facilitates QSO access by date, callsign, prefix, square, DXCC, and other parameters, offering robust import capabilities for ADIF, Cabrillo, and ASCII files from various contest and logbook programs. Key features include comprehensive award tracking for DXCC, WAZ, WAC, WPX, WAS, IOTA, TPEA, DIE, VUCC, 100EACW, and up to 30 user-defined awards. It generates customizable summaries and graphical statistics for QSO activity, DX contests, Most Wanted Squares (MWS), propagation openings, and prefixes. VQLog supports DX-Spot reception and processing from DX-Cluster and PSK-Reporter with programmable warnings, integrates with callbook services like QRZ.COM and Buckmaster's CD, and offers online lookup. Electronic QSL and log upload support extends to LoTW, eQSL.cc, Clublog, and DXMAPS, with real-time updates for online logs. The program provides extended QSO information for VHF-DXers, including separate TX/RX frequencies, start/end times, propagation modes, and specific entry fields for MS, EME, and Tropo. CAT support for rig control and interfaces with ARSWIN and PstRotator for azimuth/elevation control are also included.
 -
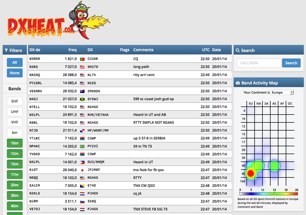 Over 15 years of experience in DXing and contesting informed the development of _DXHeat_, a responsive web DX Cluster and analytics platform. This service delivers real-time DX spots, accessible on both desktop and mobile devices, featuring intuitive filtering capabilities. Users can quickly narrow down spots by band, mode, or specific callsign, streamlining the search for rare DX or contest multipliers. The platform integrates data from various sources, including traditional telnet clusters, the Reverse Beacon Network (_RBN_), and _PSK Reporter_, offering a comprehensive view of propagation and activity. Beyond live spotting, DXHeat provides extensive cluster analytics for individual callsigns, allowing operators to research past activity and propagation trends. This deep dive into historical data can be particularly useful for planning future DXpeditions or optimizing contest strategies. The interface is designed for serious DXers, prioritizing quick access to relevant information and robust data analysis.
 -
 DX Finder presents a real-time DX cluster service tailored for amateur radio operators engaged in DX chasing and contesting. The platform aggregates DX spots, Reverse Beacon Network (RBN) data, and PSK Reporter information, displaying current activity across various amateur bands. It provides a centralized interface for monitoring propagation conditions and identifying rare DX entities, aiding operators in making timely contacts. The service integrates multiple data streams to offer a comprehensive view of global amateur radio activity. Users can access real-time spotting data, which includes callsigns, frequencies, modes, and signal reports, facilitating efficient station operation. The inclusion of RBN and PSK Reporter data enhances situational awareness, allowing operators to assess band openings and signal paths more effectively. DX Finder supports both web and Telnet access, catering to different operational preferences. It also features a dedicated JOTA cluster, specifically designed to support the Jamboree On The Air event.
 -
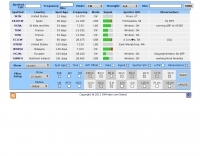
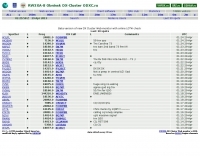 Approximately 1,500 unique DX spots are typically visible on the _ODXC Web Monitor_ at any given time, providing real-time intelligence for amateur radio operators seeking DX contacts. This service aggregates spotting data from the _RW3XA-8 Obninsk DX Cluster_ node, presenting it through a straightforward web interface. Users can monitor current activity across various HF bands, identifying stations calling CQ DX or reporting rare entities. The platform supports both traditional telnet access for those using dedicated cluster clients and a Java-based web interface, catering to different operational preferences. It serves as a practical tool for contesters and DXers to track propagation, identify active stations, and plan their operating strategies. The cluster data includes callsigns, frequencies, modes, and spotter information, crucial for effective DX hunting. Integration with other spotting networks like _RBN_ and _PSK Reporter_ enhances its utility.
 -
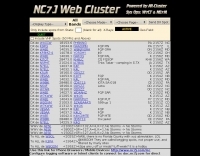 The NG7M Web Cluster, maintained by W7CT and NG7M, offers real-time DX spotting information crucial for amateur radio operators engaged in DXing and contesting activities. This service aggregates DX spots from various sources, presenting them in a user-friendly format accessible via both web interface and traditional telnet protocols. Operators can monitor band conditions, identify rare DX entities, and track propagation paths across multiple amateur radio bands. This cluster supports a wide range of operating modes and bands, facilitating efficient station operation for both casual DX chasers and serious contesters. The system integrates data from the Reverse Beacon Network (RBN) and PSK Reporter, enhancing its utility by providing automated CW and digital mode spots alongside manually entered voice spots. Access methods include a direct web interface for graphical display and a telnet connection for command-line interaction, catering to different operational preferences. The cluster's data stream is continuously updated, ensuring timely information for making critical operating decisions.
 -
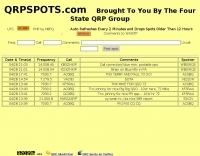 The QRPSPOTS.com domain, once a dedicated resource for QRP operators to share real-time DX spots, has undergone a significant transformation. Previously, it served the amateur radio community by providing a platform for DX spotting, including features like a telnet cluster, web cluster, JOTA cluster, and integration with RBN and PSK Reporter data. This functionality was specifically tailored to the QRP operating mode, allowing hams running low power to find and share contacts effectively across various bands. However, the current iteration of the website, as observed, no longer presents any amateur radio content. Instead, it displays information related to a Chinese educational institution, featuring sections like "About Us," "Talent Training," "Teaching and Research," and "International Exchange." The site also lists academic notices, enrollment information for international professional qualifications, and details about CPA and ACCA project classes. This shift indicates that the domain has been repurposed, moving away from its original ham radio utility. The Four State QRP Group, which previously sponsored the QRP Spots service, is no longer associated with the content presented on this URL.
 -
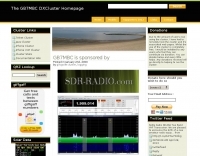
 Presents the Holy Cluster, a contemporary DX cluster service offering real-time amateur radio spot data. This platform integrates a dynamic graphical map to visualize current contacts, enhancing situational awareness for DXers and contesters. Developed by an Israeli group of developers and supported by the Israeli Association of Radio Communication (IARC), the Holy Cluster aggregates DX spots from various sources, including traditional telnet clusters, the Reverse Beacon Network (RBN), and PSK Reporter, providing a comprehensive view of band activity. The cluster's design emphasizes a user-friendly interface for monitoring DX activity across multiple bands, including dedicated support for JOTA (Jamboree On The Air) operations. Its aggregation capabilities allow operators to quickly identify propagation openings and active stations, streamlining the process of making two-way radio contacts. The integration of RBN and PSK Reporter data offers insights into propagation conditions and station reception reports, which can be invaluable for optimizing antenna direction and operating strategies.
 -
 The GB7MBC resource provides real-time DX spotting information through both web and **telnet cluster** interfaces, catering to amateur radio operators seeking immediate updates on propagation and station activity. It integrates features such as a **JOTA cluster**, RBN (Reverse Beacon Network) data, and PSK Reporter spots, offering a comprehensive view of current band conditions and DX opportunities across various modes and frequencies. The platform also includes a forum for community interaction and detailed DX cluster statistics, allowing users to analyze historical spotting data. Users can access the cluster via a standard web browser or through a telnet client, providing flexibility for different operating environments. The inclusion of RBN and PSK Reporter data enriches the spotting experience by cross-referencing reported signals with automated reception reports, enhancing the reliability and utility of the DX information. This combination of real-time data, community features, and statistical analysis makes it a practical tool for DXers and contesters.
 -
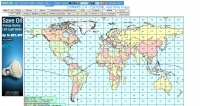
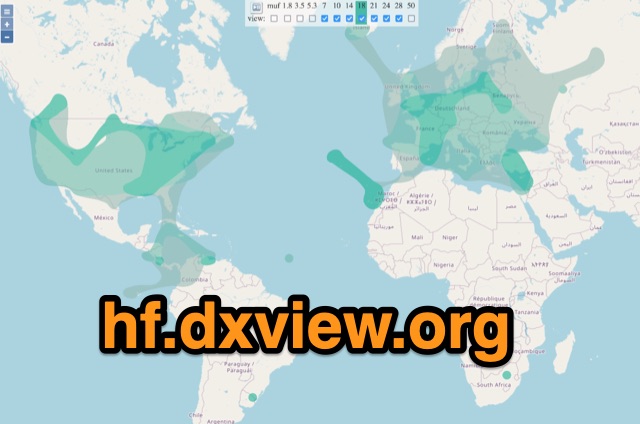 This map shows real-time radio propagation from stations operating on 11 bands between 1.8 and 54 MHz in the amateur radio service. The display shows world-wide activity from the last 15 minutes and is automatically updated about every minute. Data for the map is gathered from several online sources: WSPRnet, Reverse Beacon Network (CW, FT4, FT8), PskReporter, and DX Cluster.
 -
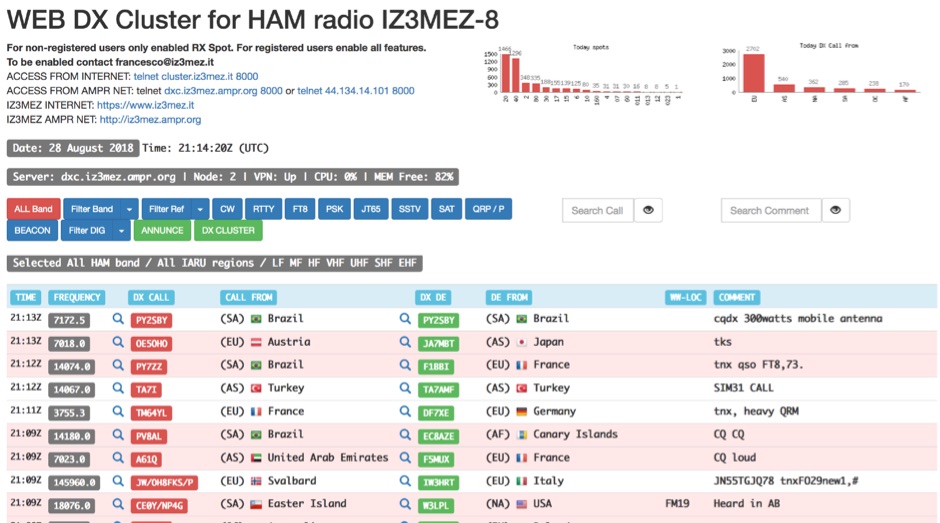 The IZ3MEZ Web DX Cluster presents real-time amateur radio DX spots across 20 distinct frequency bands, spanning from **LF (2190m)** at 135.7 kHz up to **SHF (QO-100)** at 10499 MHz. It displays the DX callsign, frequency, DXCC entity, spotter callsign, and spotter DXCC entity, along with any accompanying comments. The cluster also lists various operating modes such as CW, RTTY, FT8, FT4, FT2, PSK, and SSTV, and supports special operating activities like QRP/P and specific award programs including IOTA, POTA, SOTA, WCA, and JOTA. The cluster's interface provides a dynamic feed of the latest 50 spots, continuously updated with precise timestamps. It offers direct **Telnet protocol** access for users preferring a command-line interface, with configuration instructions provided. The resource also integrates with other spotting networks like RBN and PSK Reporter, enhancing its utility for DXers and contesters seeking propagation information and activity monitoring across a broad spectrum of amateur radio frequencies.
 -
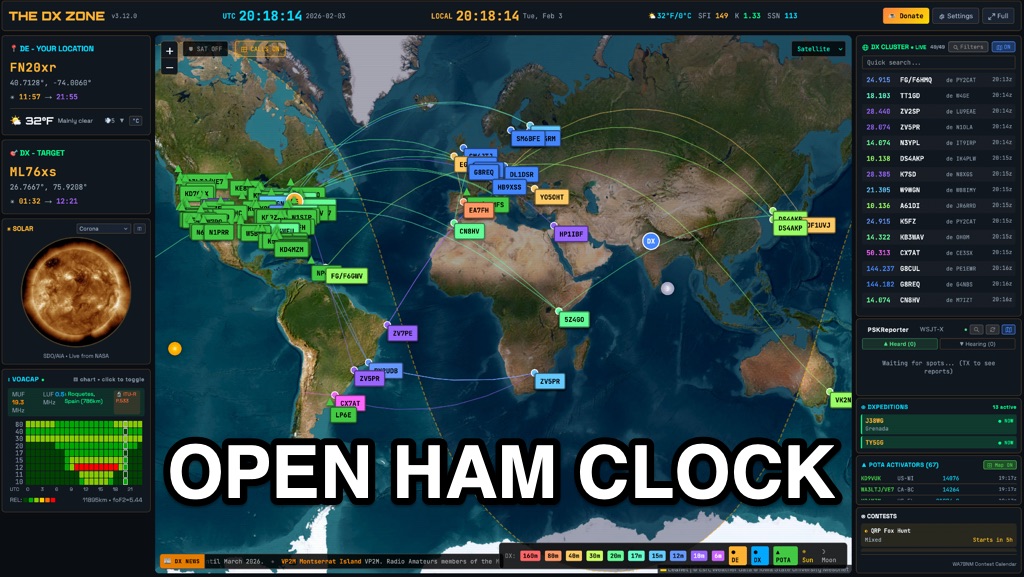 OpenHamClock is a modern, open-source dashboard for amateur radio operators, designed as a web-based successor to the original HamClock. Deployable locally on a Raspberry Pi or via the cloud, it centralizes essential DX operations into a single, intuitive interface. At its core is an interactive world map that visualizes real-time DX spots, signal paths, satellite tracking, and POTA activators. The software seamlessly integrates critical tools like WSJT-X, DX Cluster, and PSKReporter for monitoring digital traffic. Additionally, it provides vital environmental data, including real-time space weather indices, solar activity, and personalized HF propagation predictions. With customizable themes and a modular architecture, OpenHamClock offers modern operators comprehensive, at-a-glance situational awareness of global radio conditions
 -
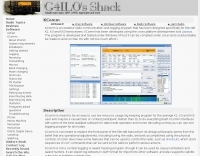 KComm, a logging and communication program, was specifically engineered for Elecraft K2, K3, and KX3 transceivers, leveraging the Lazarus cross-platform development tool. It operates natively on Windows XP and can be compiled for Linux, with potential for macOS, prioritizing low resource usage for casual DXers and contest participants. The software integrates with external applications like Fldigi for diverse digital modes and CW Skimmer for advanced Morse decoding, enhancing its functionality beyond basic logging. The design philosophy of KComm emphasizes utilizing the physical radio controls for operational adjustments, rather than replacing the transceiver's front panel. It facilitates keyboard CW operation via the Elecraft serial protocol and capitalizes on the K3 and KX3's built-in decoders for RTTY and PSK31. Additionally, KComm supports PSK31, PSK63, and PSK125 through the AE4JY PSK Core DLL on Windows and integrates with PSKReporter.info for spotting. While not a dedicated contest logging or award tracking program, KComm supports ADIF and Cabrillo export for casual use, allowing logs to be imported into other software. The author, G4ILO, ceased all software development, providing KComm "as is" without further support or updates; however, the source code is available under the GNU GPL for community continuation.
 -
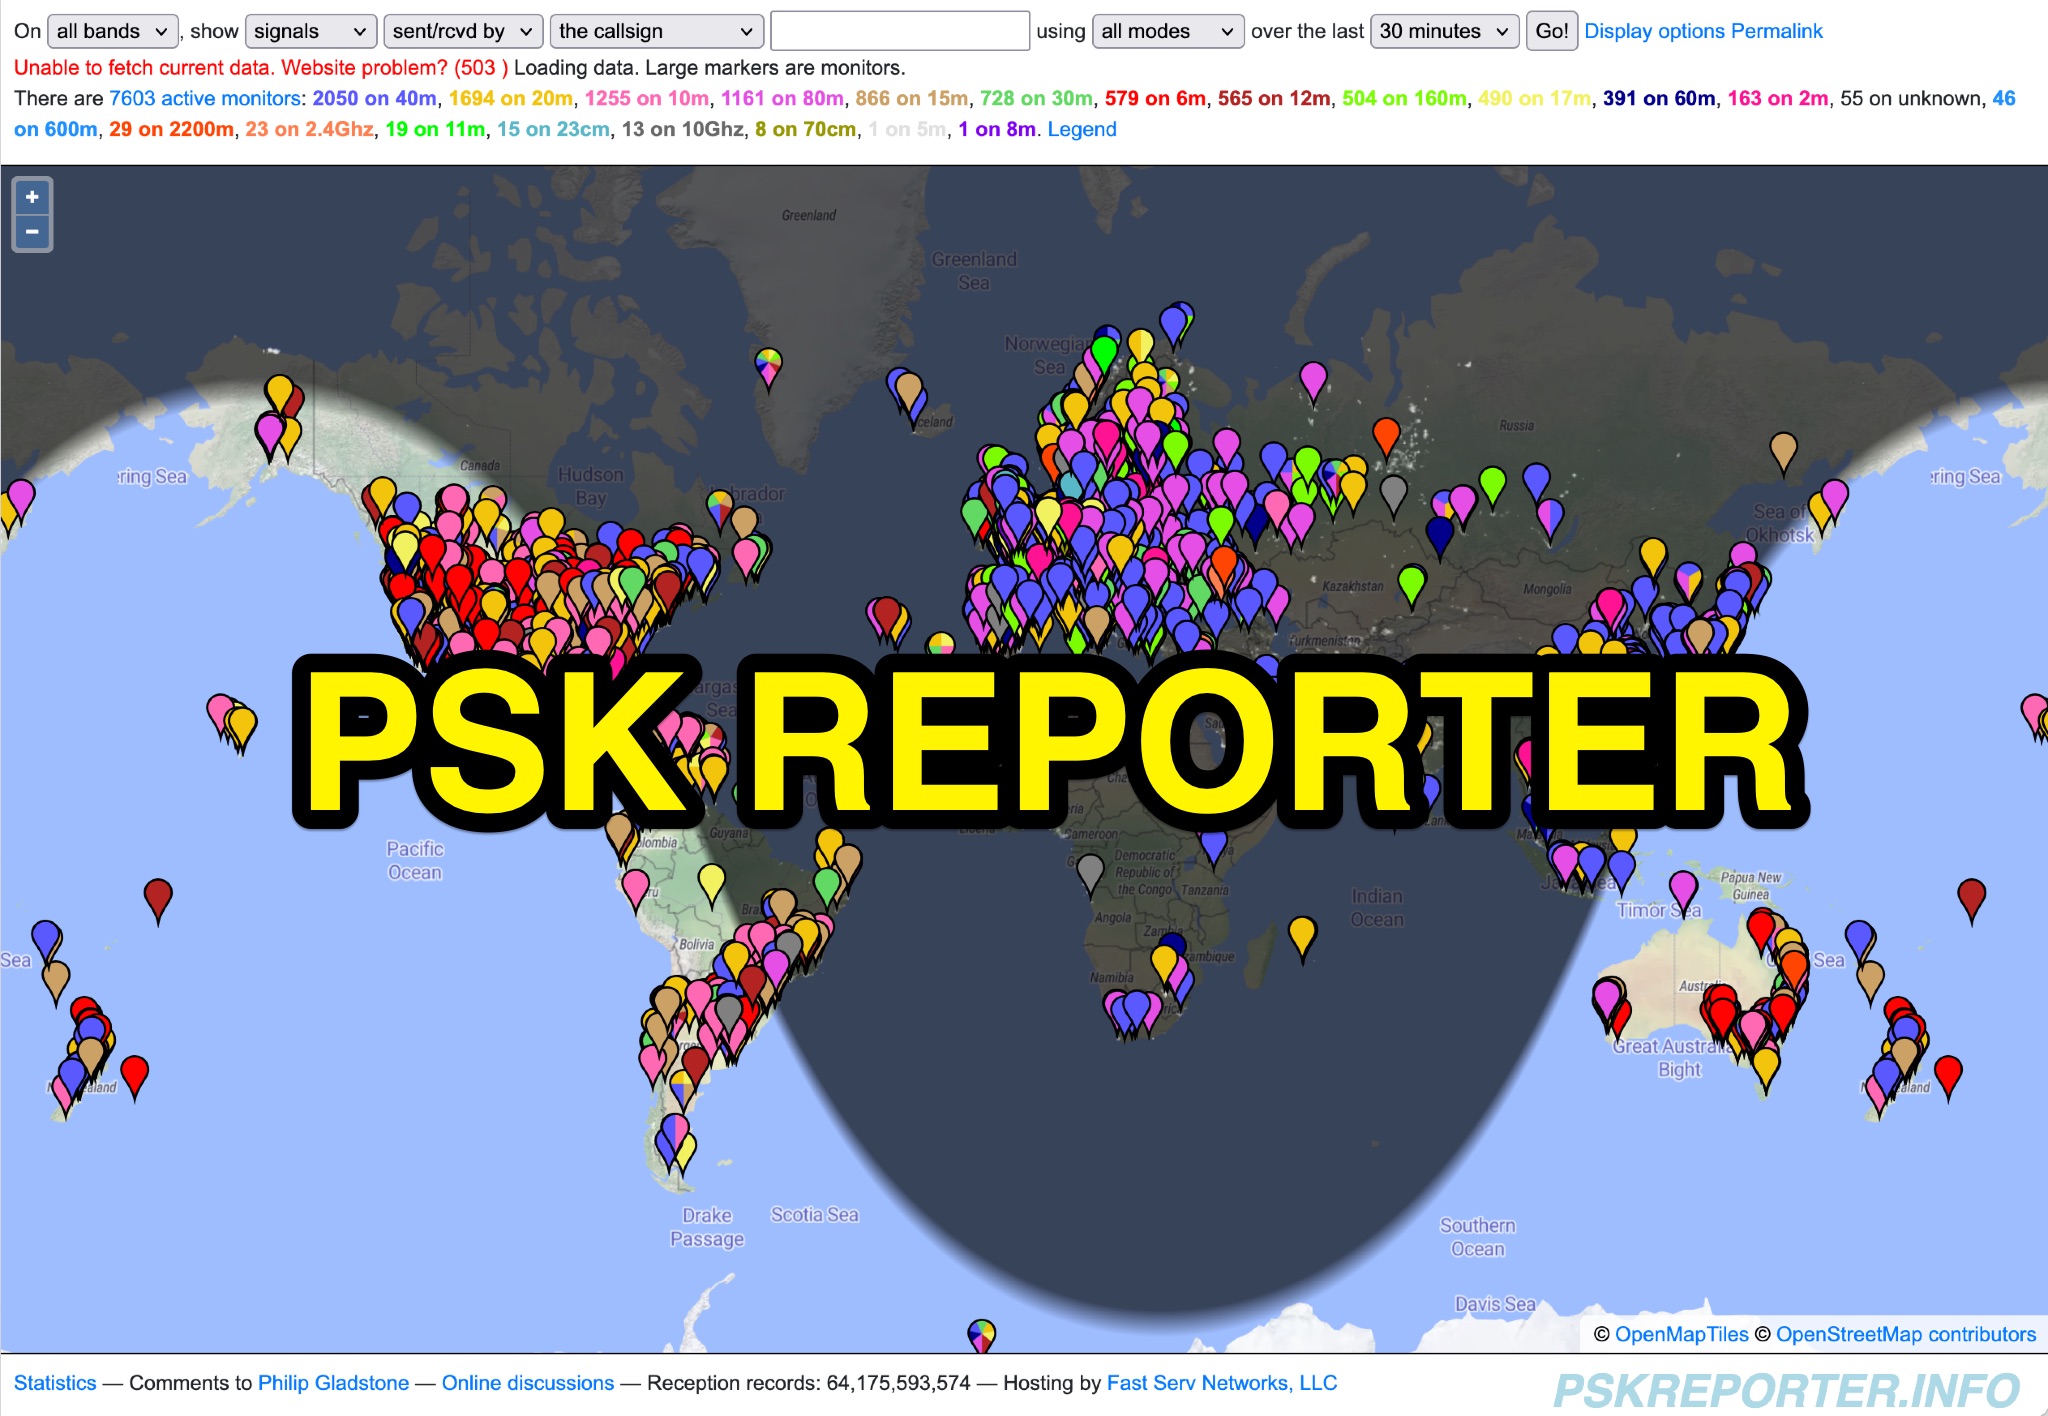 PSK Reporter provides a real-time visualization of amateur radio digital mode reception reports, aggregating data from a global network of monitoring stations. This platform is particularly useful for operators utilizing modes such as FT8, FT4, and PSK, allowing them to observe signal propagation paths and assess their station's reach. The interactive maps display reception reports, enabling hams to analyze band conditions and optimize antenna performance for various frequencies and times of day, aiding in understanding ionospheric conditions. Operators can filter reports by callsign, band, mode, and time, gaining insights into specific propagation events or evaluating the effectiveness of their transmit setup. The data collected helps in predicting optimal operating windows for DX contacts across various digital modes. Philip Gladstone is the contact person for comments and discussions regarding the system.
 -
 Do you want to see how your FT8 signals are being received in the other parts of the globe?
 -
 PSK Reporter,is a powerful tool for monitoring your FT8, JT65 or PSK signals around the world. But, even if you are not transmitting on any of these modes it can still be a great propagation tool for determining which bands are open and to where in the world signals from your area are being heard.
 -
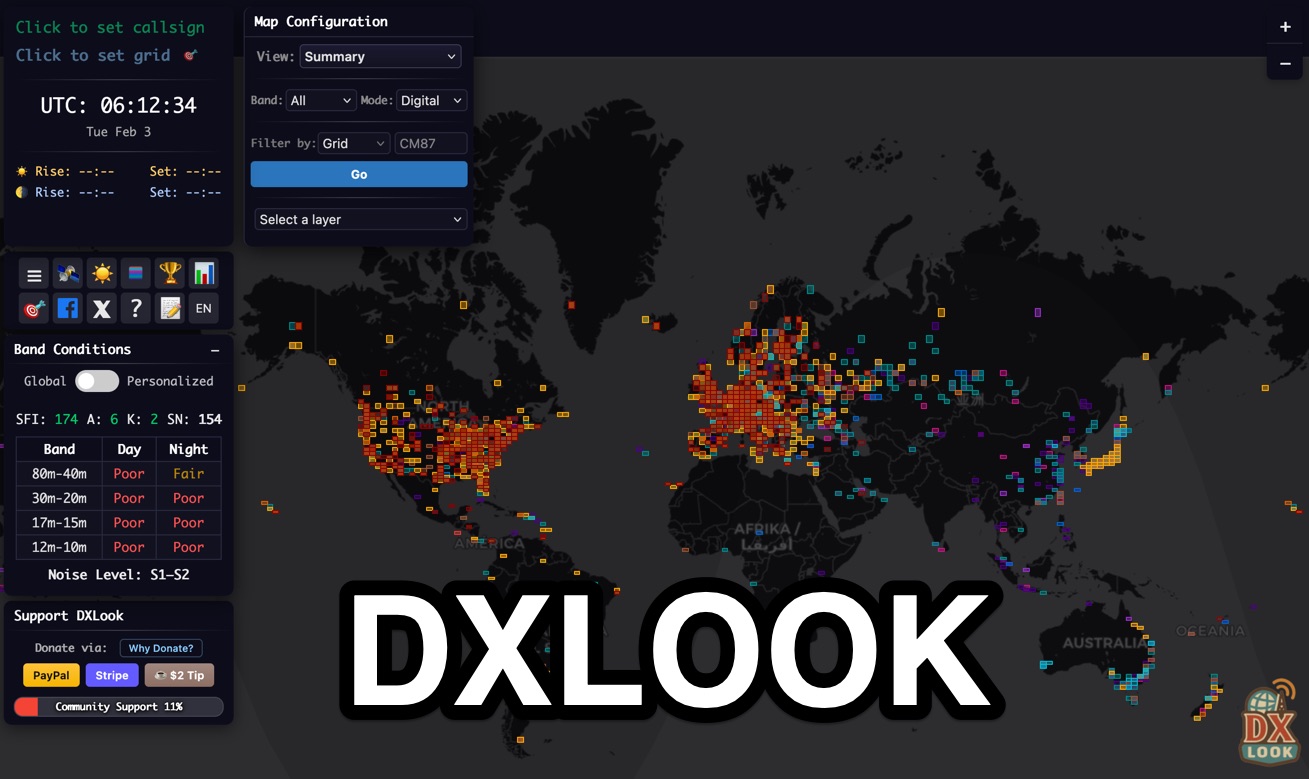 DXLook is a free, web-based propagation platform that delivers comprehensive, real-time insight into HF and VHF conditions directly from any modern browser. It aggregates live spots from PSK Reporter, WSPRnet, RBN, and DX Cluster, complemented by NOAA space-weather metrics such as SFI, K/A indices, and geomagnetic alerts. Integrated VOACAP predictions allow practical "theory versus reality" comparisons, while the interactive world map with filters, gray line, and grid overlays enhances situational awareness. With no installation or maintenance required, DXLook provides a convenient, accurate, and accessible solution for everyday operating and propagation analysis.
 -
 Time Mapper UHD is a versatile mapping and time visualization program offering multi-satellite viewing with frequency display and unique country-pairs for PskReporter data. It features live feeds from logging programs and can plot ADIF files. Ideal for schools, offices, or amateur radio stations, it provides customizable 4K or HD world clock displays with over 60 map layers, including ham radio zones and natural features. The program supports various time functions and can import logs for detailed analysis. It runs on Windows 10 or 11 and offers a 30-day free trial.
 -
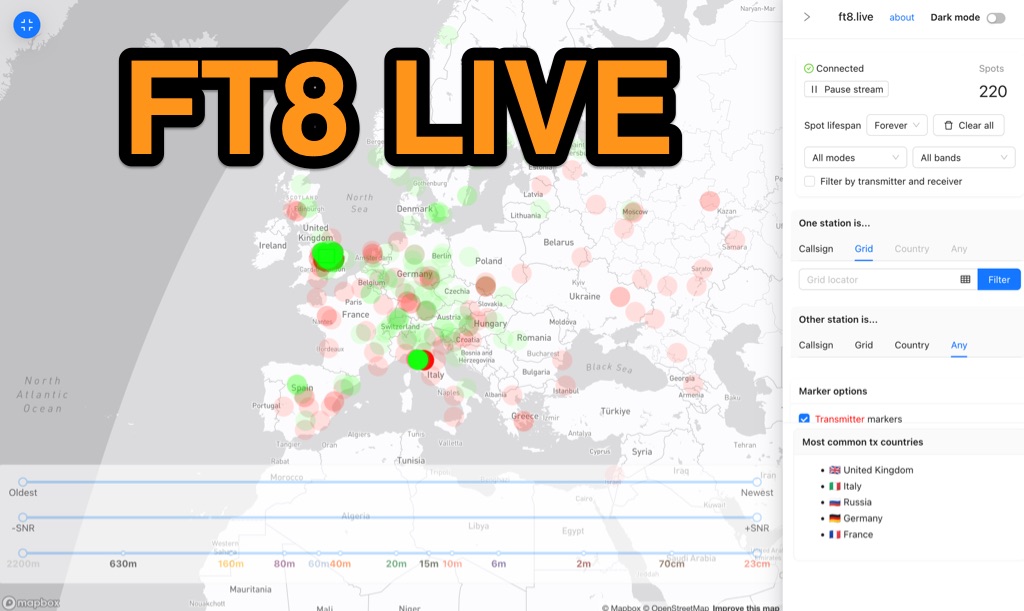 Visualizes real-time amateur radio propagation spots using data from the PSK Reporter MQTT stream, providing immediate situational awareness for radio operators. The platform displays spots from various modes, including CW, WSPR, and JT65, in addition to the dominant FT8 digital protocol. FT8 Live focuses exclusively on live data streams, prioritizing current signal activity over historical archiving, which differentiates it from the official PSK Reporter map. A key feature is its integration with the Summits on the Air (SOTA) API, facilitating SOTA chasing by cross-referencing transmitting callsigns with SOTA alerts; a station is identified as an activator if the spot correlates with a scheduled alert within an eight-hour window. The user interface was developed by Arron (ZL1AN), with core data from Philip Gladstone (N1DQ), and stream delivery managed by Tom Stanton (M0LTE).
 -
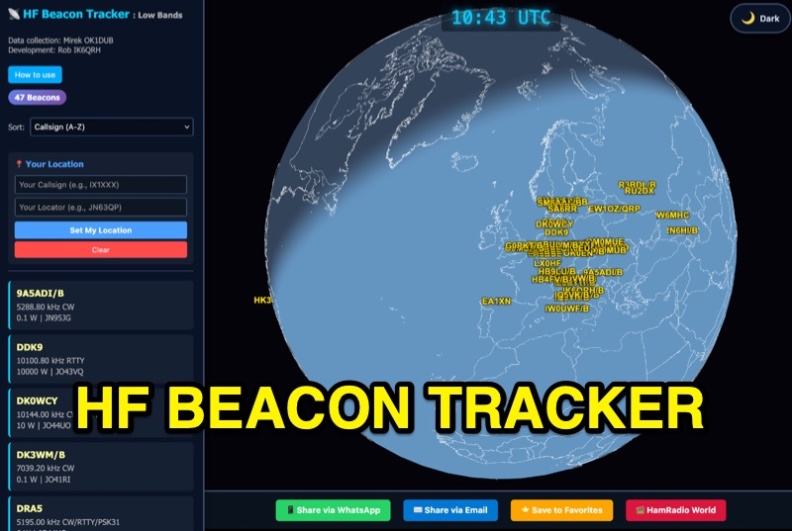 The HF Beacon Tracker is an advanced interactive tool designed for DXers and ham radio opoerators in general to monitor active beacons operating below 14 MHz. Built upon a high-fidelity 3D Earth globe, the application provides a spatial perspective on signal paths by integrating real-time environmental data with a comprehensive beacon database curated by Mirek OK1DUB. Beacons are plotted using precise Maidenhead locators and feature a real-time day/night terminator overlay to help operators identify Gray Line propagation opportunities. With a single click, users can calculate the exact distance from their own QTH to any beacon, visualized via an animated Great-Circle Path arc on the globe surface. To enhance its diagnostic capabilities, the tool seamlessly integrates with PSK Reporter, allowing users to right-click CW beacons to instantly fetch current reception reports and signal strength data. The interface is fully optimized with a mobile-responsive design, smooth globe rotation, and togglable Dark/Light themes suitable for any shack environment. Whether you are performing antenna gain tests, conducting ionospheric research, or simply hunting for band openings, the HF Beacon Tracker transforms raw database information into an intuitive, visual diagnostic suite. It serves as an essential asset for any operator looking to master HF band conditions.
 -
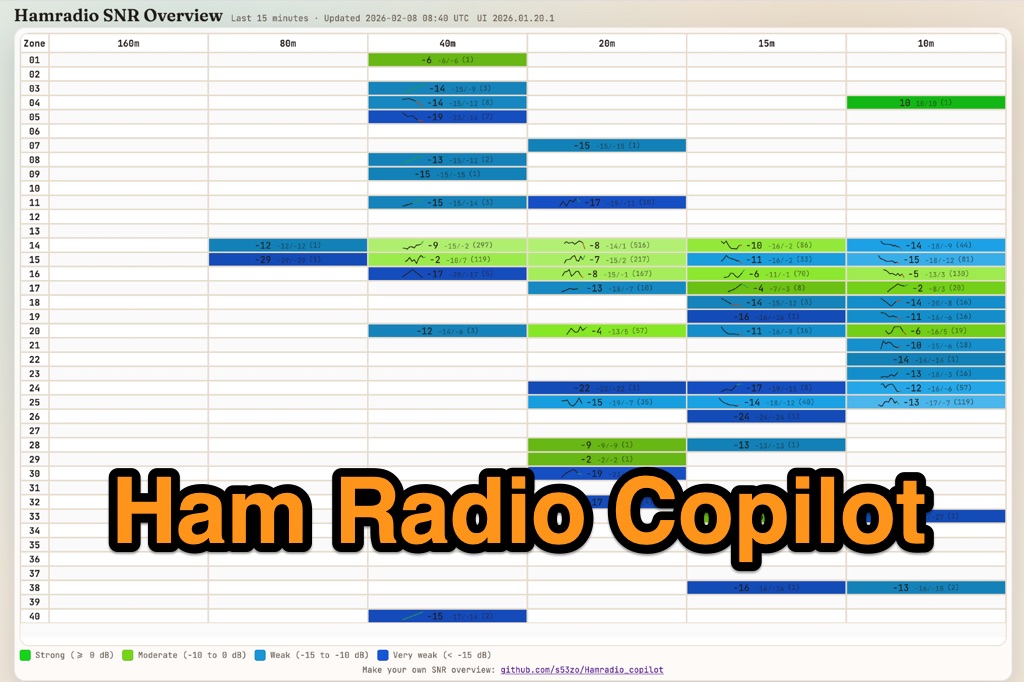 Hamradio_copilot is an open-source tool designed for DXers and contesters who need real-time situational awareness. It is ideal for operators who want to visualize propagation trends instantly rather than scrolling through raw text streams of cluster spots. Rally acting as a copilot for your station, this tool transforms raw data into actionable intelligence. By visualizing Signal-to-Noise Ratios (SNR) across different bands, it helps operators make quick decisions on which band to prioritize or where to point their antennas, effectively showing not just who is on air, but where the propagation is currently open from your location. This is a fantastic information for avid contesters. The software aggregates data from two primary services: - Reverse Beacon Network (RBN) via Telnet. - PSK Reporter via MQTT feeds. It processes this data to generate a comprehensive HTML report featuring SNR heatmaps and statistical breakdowns by ITU Zone. Users can filter data by specific zones or country codes (ADIF), analyze historic time ranges, and optionally integrate solar weather data. The complete source code is available on GitHub, allowing for community customization. It is written in Python and uses SQLite for data management.
 -
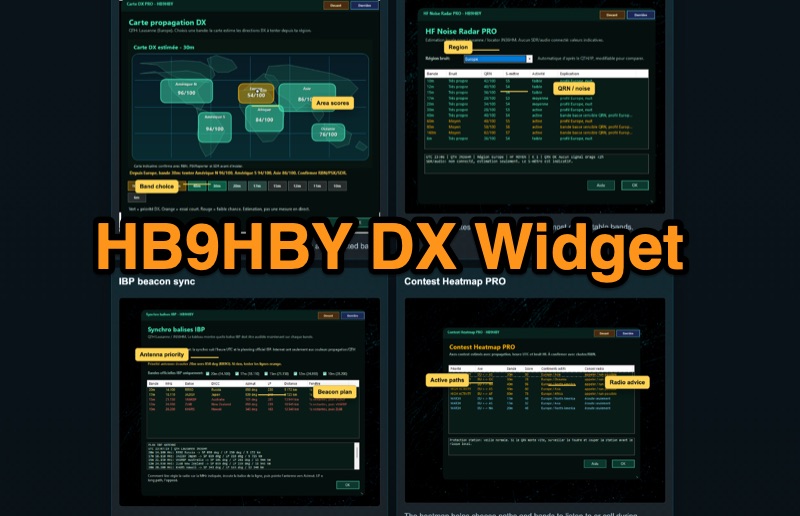 Demonstrates the _Widget DX HB9HBY_ software, a compact desktop application for amateur radio operators, providing essential real-time information. The widget displays UTC time, current HF propagation conditions, local weather, and thunderstorm risk. It also integrates radio-related links and offers advanced PRO functions, such as a DX map, HF noise radar, IBP beacon synchronization, contest heatmap, aurora radar, and a rare DX radar. The software is available for Windows 10/11 and Linux, with a macOS version planned for future release, and supports both French and English interfaces. Author HB9HBY highlights the widget's simple installation process and automatic update capabilities, which can be silent for minor fixes or include notifications for significant changes. The free version provides core functionalities, while a 15-day free trial unlocks the PRO features. A lifetime PRO license is available for a one-time payment of CHF 10, activating advanced tools that help operators make quicker decisions at the station by correlating propagation, UTC, DX activity, and local conditions, though results remain indicative and require confirmation via listening or tools like _RBN_ or _PSKReporter_.
 -
 Spotty leverages Philip Gladstone’s pskreporter.info data, delivered via an MQTT broker by Tom Fanning (M0LTE), to offer a responsive web application for visualizing propagation. The Map View presents a default visualization (grid AA00 / callsign MY8CALL) and distinguishes signal types: small spots for signals heard by a location, large spots for transmissions from a location, and teardrop markers for transmissions from the monitored callsign. Clicking a spot reveals detailed signal data in an overlay. The application includes a Log View for raw spot data and a Settings tab for customization. Users can filter tracking by specific Callsign or Grid, with preferences saved to the browser. A notable feature is the Time to Live (TTL) setting, adjustable from the default 60 seconds, which controls spot visibility duration to manage map clutter during high-traffic periods. The tool provides a clear, logic-driven interface for real-time signal monitoring.
 -
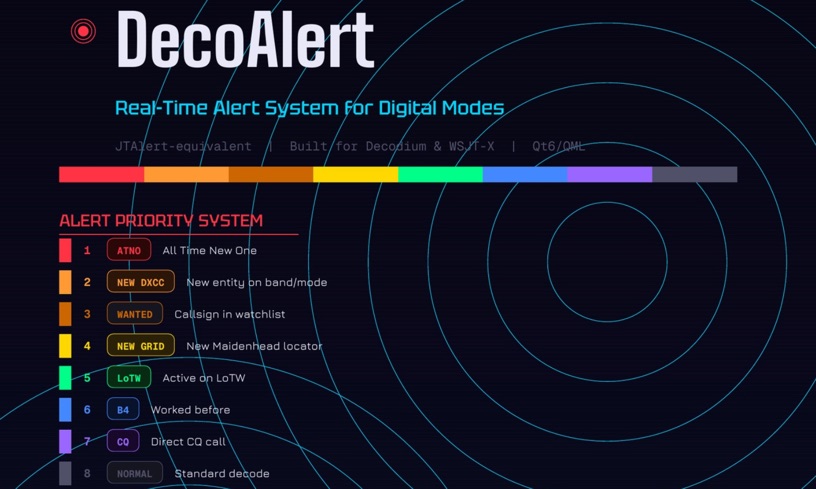 DecoAlert 1.0 Beta is a companion application designed to enhance the digital mode operating experience, specifically for FT8, FT4, and FT2. It operates by monitoring UDP data streams from primary decoding software like _Decodium_ and _WSJT-X_ on port 2237. The software provides real-time, priority-based audio alerts using WAV sounds for various conditions, including All Time New Ones (ATNO), new DXCC entities per band/mode, user-defined watchlist callsigns, new Maidenhead grid squares, and LoTW-active stations. It also highlights previously worked stations (B4) and integrates live DX spots from Telnet clusters, offering a comprehensive suite of tools for serious digital mode operators. The application features a built-in SQLite database for tracking worked stations and integrates with LoTW user lists to identify confirmed contacts. A DX Cluster client supports multiple Telnet servers, providing a broad view of propagation. PSKReporter statistics are available by band and mode, offering insights into signal paths. The QSO log viewer includes search and filter capabilities, while an _OpenStreetMap_ (OSM) interface visualizes spot locations, aiding in situational awareness. DecoAlert requires Windows 10/11 (64-bit) and compatible digital mode software configured to send UDP data.
 -
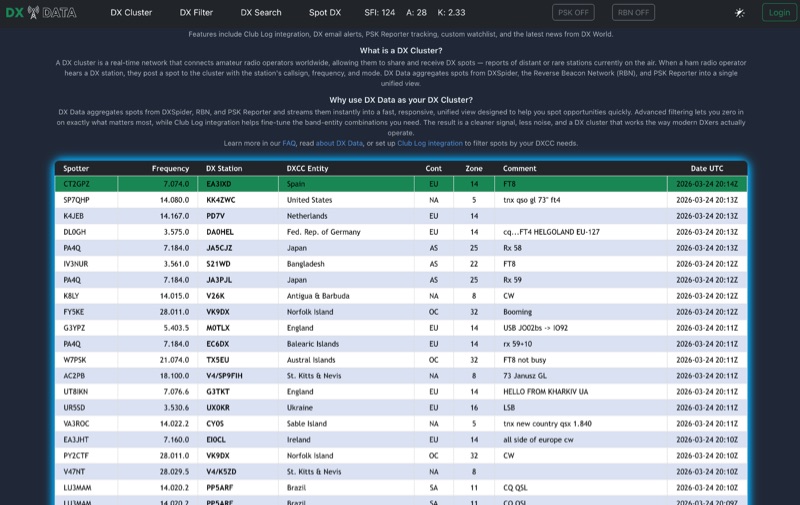 DX Data provides a unified view of real-time DX spots, aggregating data from **DXSpider**, the **Reverse Beacon Network (RBN)**, and PSK Reporter. This online service offers advanced filtering capabilities, allowing amateur radio operators to refine spot displays by DXCC entity, band, mode, CQ zone, and continent. It addresses the challenge of sifting through numerous DX spots by presenting a consolidated stream, enabling DXers to efficiently identify active stations across various bands and modes. The platform integrates with Club Log, which assists in fine-tuning band-entity combinations based on a user's logging history, thereby reducing irrelevant spot noise. Key features include DX email alerts, PSK Reporter tracking, and a custom watchlist for monitoring specific stations or regions. The service also incorporates a live news feed from DX World, providing current information relevant to the DXing community. This design aims to streamline the DX spotting process, offering a responsive interface for identifying operating opportunities.
 -
 Compare the efficiency of two HF (or VHF) antennas by simultaneously transmitting FT8 on nearly the same frequency and analyzing PSKReporter SNR data. Determine the effectiveness of your new antenna compared to the old one in dB, to several decimal places. Run FT8 on two transmitters with different call signs and equal power, connected to each antenna. AntennaCompare analyzes global signal reports, isolating antenna performance.
 -
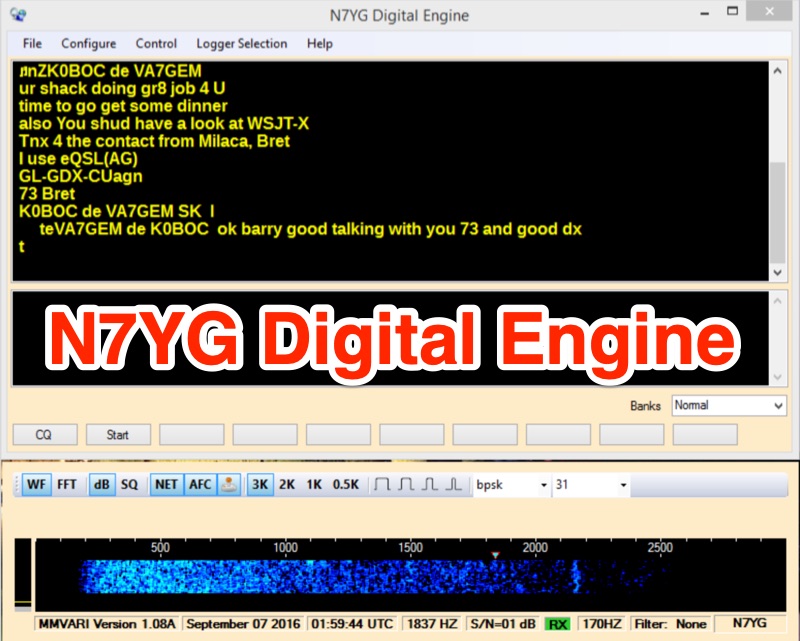 The N7YG Digital Engine, functions as a streamlined digital modem, supporting **PSK**, **RTTY**, and **MFSK** modes. It eliminates many ancillary logging and awards features found in other software, focusing instead on providing a dedicated digital interface. The software is specifically engineered to complement the N3FJP logging suite, offering a simple digital modem with a floating waterfall display that can coexist on the same screen as the logger. The application includes support for PSK Reporter, EXTFSK, TinyFSK, and K1EL Winkey FSK, enhancing its utility for various digital operations. Key features comprise a separate waterfall window, a main GUI with operational controls, receive and transmit display areas, and 10 Macro Buttons across 10 user-definable macro banks, totaling 100 macros for general and contesting use. Configuration options include sound card selection, digital gain (0-32767), AFC Level (0-100), AFC Width (in Hz), and COM Port TX keying for VOX/SignaLink or direct port control. Input and Output Mixer buttons provide direct access to OS audio mixer controls for precise level adjustments. The software is digitally signed with a security certificate, aiming to prevent conflicts with antivirus programs.
 -
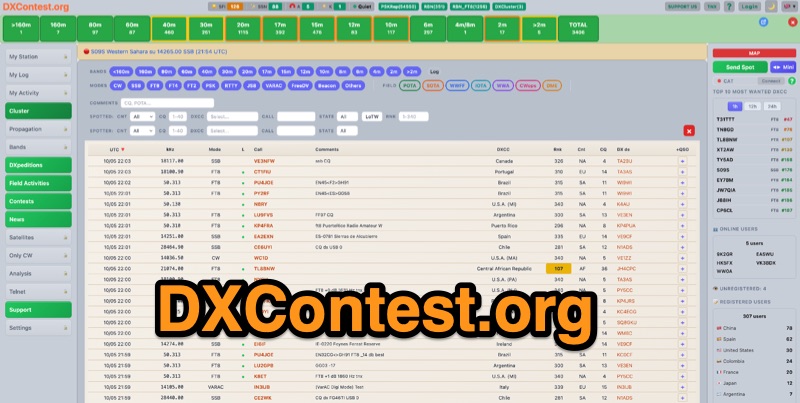 DXContest.org provides a real-time DX cluster, integrating advanced spotting capabilities with features like _propagation maps_, _PSKReporter_, and the _Reverse Beacon Network_. This platform enables radio amateurs to monitor DX activity, apply sophisticated filters to spot data, and even utilize CAT control for their transceivers directly through the web interface. The service is designed for immediate utility, offering free access without requiring user registration. Users can send DX spots, control their radio via CAT, and consult a contest calendar. The platform also provides traditional Telnet access for those preferring client-based cluster interaction. Developed by Pascual R. Salas Vidal, EA5WU, the service aims to be a comprehensive tool for real-time DX operations and contest participation, offering a blend of modern web features and classic cluster functionality.