Search results
Query: map
Links: 371 | Categories: 12
Categories
- Manufacturers > Amateur Radio Maps
- DX Resources > DX Maps
- Software > Grid Bearing and Maps
- Operating Modes > Repeaters > Repeater maps
- Operating Aids > Maps
- Software > RF Coverage Mapping
- Software > APRS
- Operating Aids > Distance & Bearing
- Operating Aids > Grid Squares
- DX Resources > IOTA
- Ham Radio > Regional > Ukraine
- Operating Modes > Repeaters > USA
-
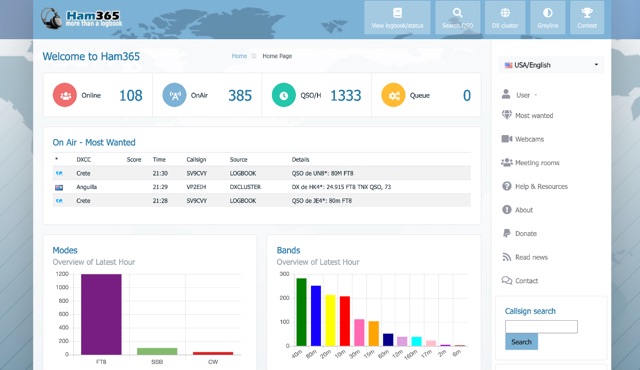 Over 15 years of continuous operation, Ham365 provides a web-based logging solution for Amateur Radio Operators, allowing them to maintain and share their QSO records online. Originally launched as the online logbook component of Ham Radio Deluxe, it has since evolved into an independent platform, now integrating with numerous other logging applications. The platform shares its database with HRDLOG.net, ensuring that operations performed on one site are reflected on the other, maintaining data consistency for users. Key features include an overview of the latest hour's activity, a display of the most recent QSOs, and a map visualizing recent contacts. It also highlights "Most Wanted" entities and ongoing DXpeditions, providing a dynamic view of current amateur radio activity. The logbook supports various operating modes, including SSB, RTTY, PSK31, and FT8, and handles ADIF data for interoperability. Users can manage their logbooks, track DX activity, and utilize features like OQRS (Online QSL Request System) through its integrated functionalities. The system is designed to be accessible to a wide range of operators, from casual ragchewers to avid DXers and contesters.
 -
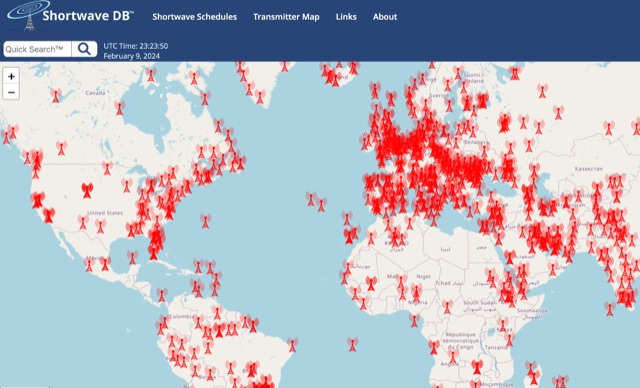 Worldwide Map of shortwave transmitters. Based on shortwave schedule database, this website let you serarch using filters for broadcasts schedule and at the same time to diplay the transmitter map.
 -
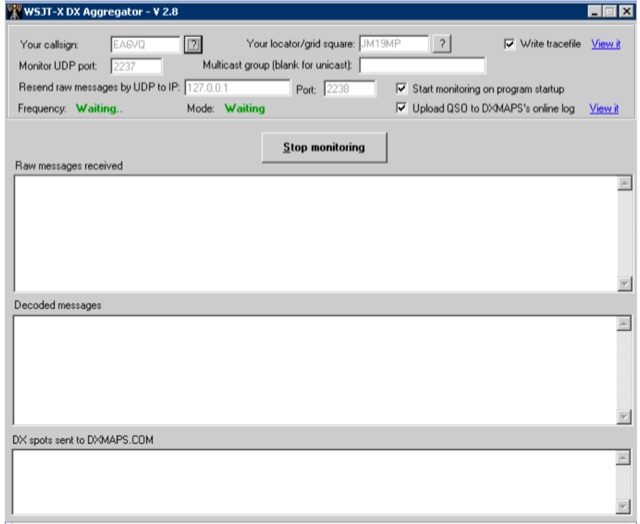 WSJT DX Aggregator is a program that allows the stations using the WSJT-X or JTDX or MSHV programs to automatically upload DX reports to DXMAPS.com
 -
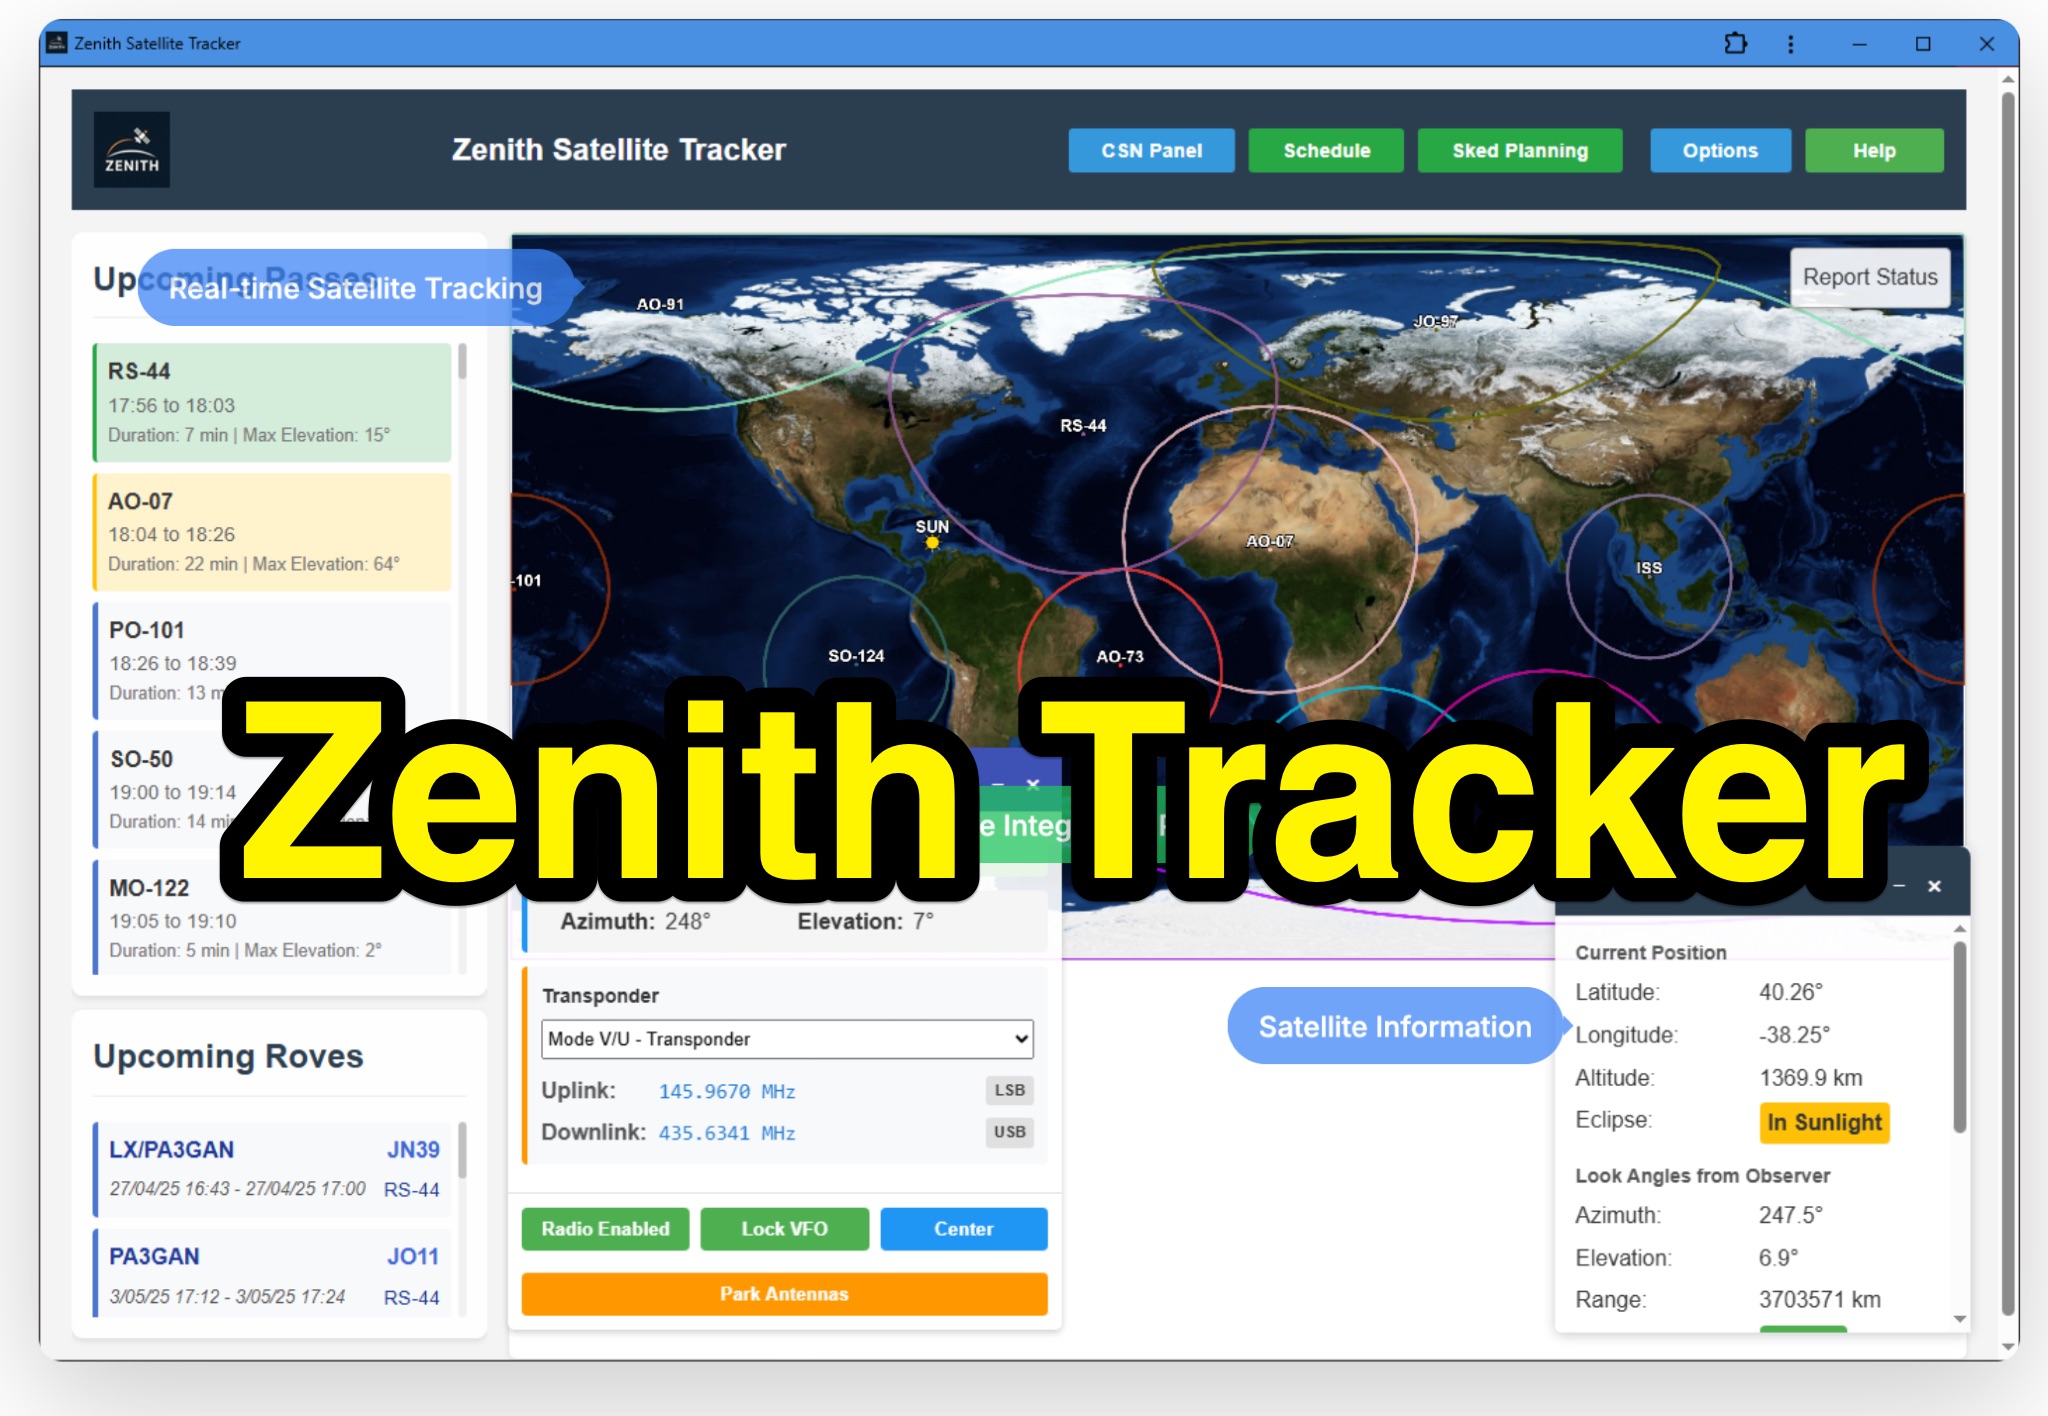 Zenith Tracker offers real-time satellite tracking, pass predictions, and radio hardware integration for ham radio operators. The platform includes an interactive world map showing satellite positions, footprints, and ground tracks, as well as a polar radar visualization for detailed pass analysis. Users can view upcoming passes, set filters, and receive notifications. Integration with CSN Technologies S.A.T Hardware and QTRigDoppler allows for automatic radio control, antenna tracking, and transponder management. The platform also offers APRS message interface, grid square-based location input, and API integration for rover activations. Zenith Tracker is recommended for both general users and those needing advanced hardware integration.
 -
 The NOAA/GML Solar Calculator provides critical data for **solar position** and timing, including sunrise, sunset, and solar noon, for any geographic location on Earth. Users can input specific dates and times, or select from predefined locations such as World Cities, U.S. Cities, GML Observatories, and GML Data Sites. The interface allows for precise geographical input by dragging a red pin on an interactive map, complemented by extensive time zone selections and UTC offset adjustments. Key outputs include the Equation of Time, Solar Declination, and the sun's azimuth in degrees at local time. The tool also generates comprehensive sunrise/sunset tables for an entire year, opening these data sets in a new browser tab for easy access and analysis. While the calculator remains operational, NOAA explicitly states it is no longer actively supported or maintained, advising users that accuracy and functionality cannot be guaranteed, and no further updates or technical support will be provided. Despite the lack of ongoing support, the resource details the underlying calculations and offers spreadsheets for users interested in performing their own solar data computations. It also includes links to older versions of the solar calculator and a glossary of relevant terms, serving as a reference for understanding solar mechanics and their impact on radio propagation.
 -
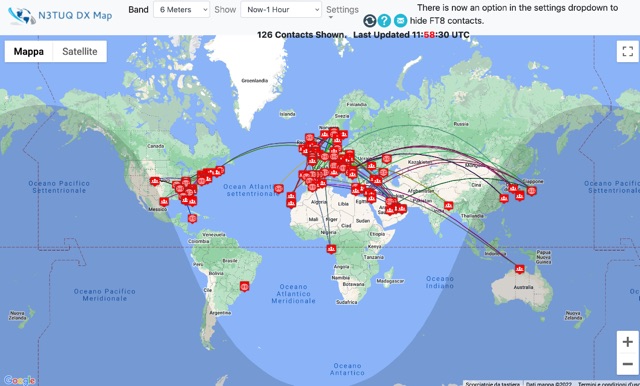 DX Cluster spots represented in a google map, for 10m 6m 2m bands taken from the VE7CC DX Cluster. Some filtering options are available.
 -
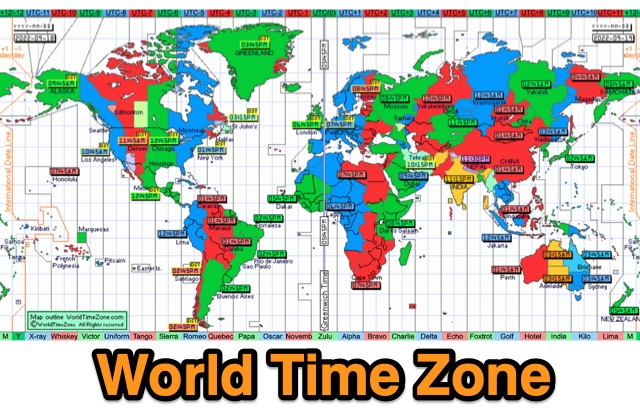 World Time Zone is an online quick reference chart that displays the world time zones in detail. DST is also indicated by yellow markers on the map. UTC difference is marked with different colors, and if you point and click will show up area details
 -
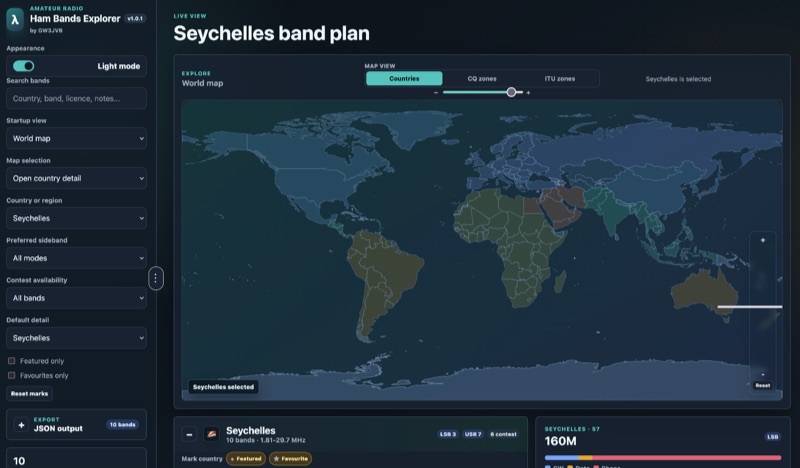 Presents an interactive **Ham Bands Explorer** web application, offering a live view of all amateur radio bands overlaid on a world map. This resource displays **CQ zones** and **ITU zones**, with geographical data sourced from HB9HIL/hamradio-zones-geojson under an MIT license. The interface provides a dynamic visualization of global band conditions, enabling operators to observe activity patterns across different regions. Users can select individual countries to retrieve and display their specific band plans, with frequency coverage details loaded from CountryData.json. The tool indicates 100% frequency coverage, ensuring comprehensive data presentation for selected regions. This functionality supports detailed analysis of national regulatory variations within the amateur spectrum. The application integrates both a map view and a live view, facilitating real-time monitoring and geographical context for band usage. It serves as a practical reference for understanding international amateur radio regulations and visualizing propagation characteristics across various frequency allocations.
 -
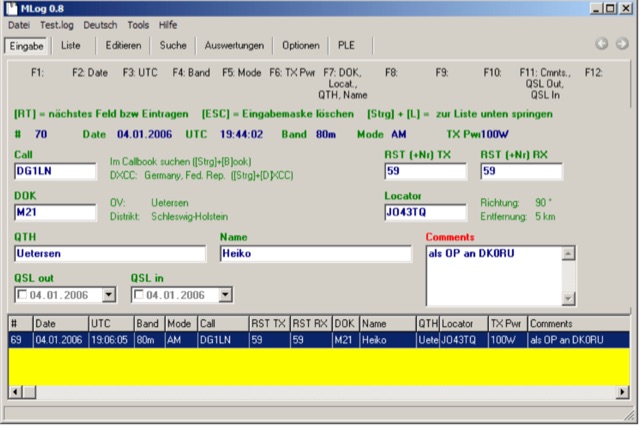 MLog 0.8d is a freeware logging software designed for Windows operating systems (NT, 98, ME, 2000, XP) that facilitates the logging, management, and analysis of amateur radio QSOs. It features a customizable input mask for rapid contest logging, a robust search function for existing contacts, and immediate data storage in CSV format to prevent data loss. The software also includes a double-check mechanism against reference logs during callsign entry, integrated DXCC information, and a "magic field" for streamlined data input, all within a single-window interface. Key functionalities include graphical QSL card management via _QSL-Collection_, CW output through soundcard or PC speaker, and direct access to _Radio Amateur Callbook_ data. MLog supports transceiver control via _Ham Radio Deluxe_ URLs, offers a detailed world map with locator conversions, and can launch _VOACAP_ through _HamCap_. It provides extensive data analysis options for QSLs, _Locator_ large fields, _DOKs_, _DXCCs_, QSO counts, and user-defined contest evaluations, alongside flexible import/export capabilities for various log formats.
 -
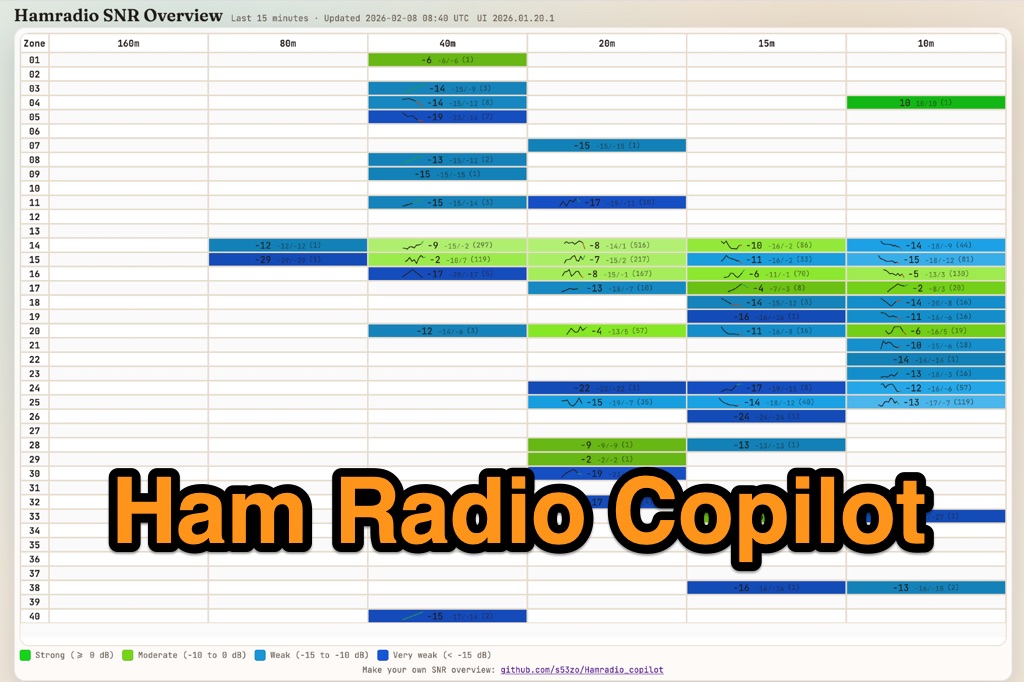 Hamradio_copilot is an open-source tool designed for DXers and contesters who need real-time situational awareness. It is ideal for operators who want to visualize propagation trends instantly rather than scrolling through raw text streams of cluster spots. Rally acting as a copilot for your station, this tool transforms raw data into actionable intelligence. By visualizing Signal-to-Noise Ratios (SNR) across different bands, it helps operators make quick decisions on which band to prioritize or where to point their antennas, effectively showing not just who is on air, but where the propagation is currently open from your location. This is a fantastic information for avid contesters. The software aggregates data from two primary services: - Reverse Beacon Network (RBN) via Telnet. - PSK Reporter via MQTT feeds. It processes this data to generate a comprehensive HTML report featuring SNR heatmaps and statistical breakdowns by ITU Zone. Users can filter data by specific zones or country codes (ADIF), analyze historic time ranges, and optionally integrate solar weather data. The complete source code is available on GitHub, allowing for community customization. It is written in Python and uses SQLite for data management.
 -
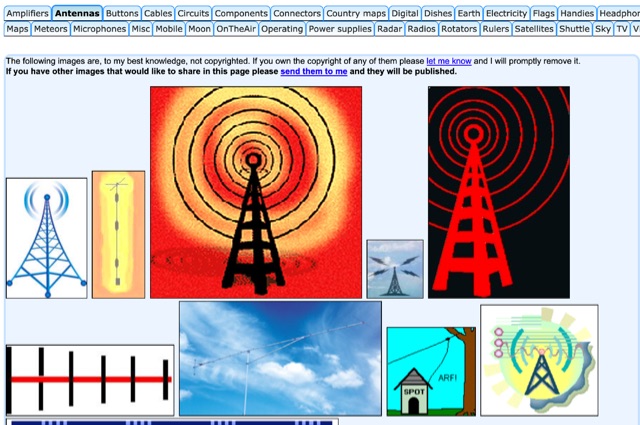 HAM radio related clipart gallery, is a large collection of amateur radio gifs and jpeg images classified in several categories
 -
 An online database featuring current and historical weather balloons, complete with a fully searchable archive that can be filtered by launch site. The integrated map shows both the current and historical trajectories of radiosondes, from their launch points to their final landing positions.
 -
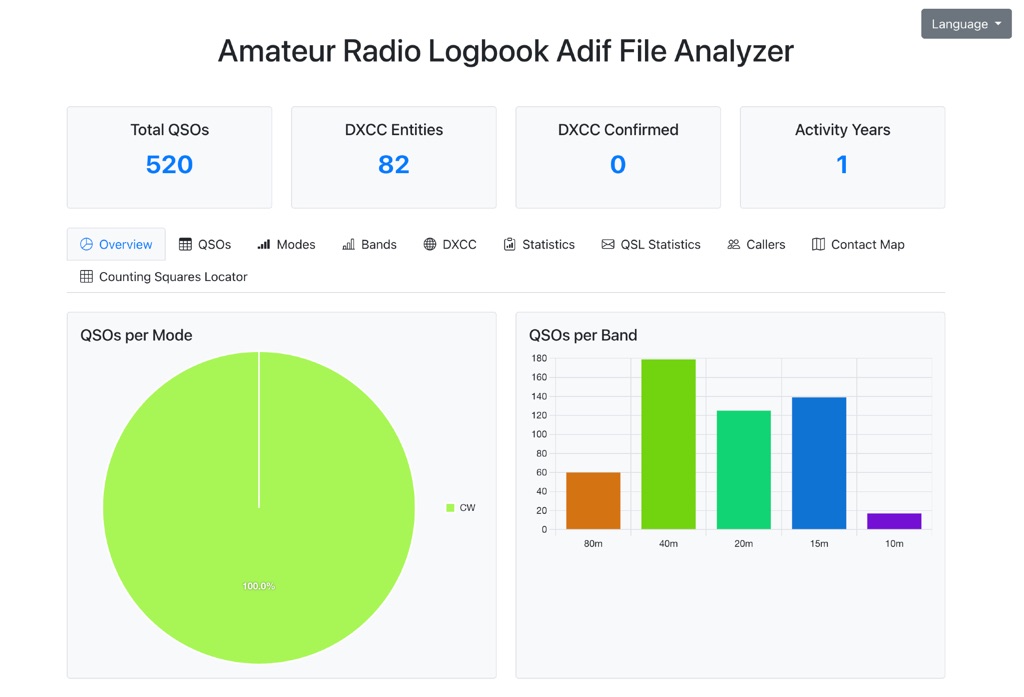 The Amateur Radio Logbook ADIF File Analyzer available at loganalyzer.sv5fri.eu is a convenient web-based tool that allows you to upload your ADIF log and instantly generate a visual map of your QSO contacts along with detailed statistics—by band, mode, time, grid squares, DXCC, and more. It provides an intuitive overview of your operating patterns and performance without requiring any software installation.
 -
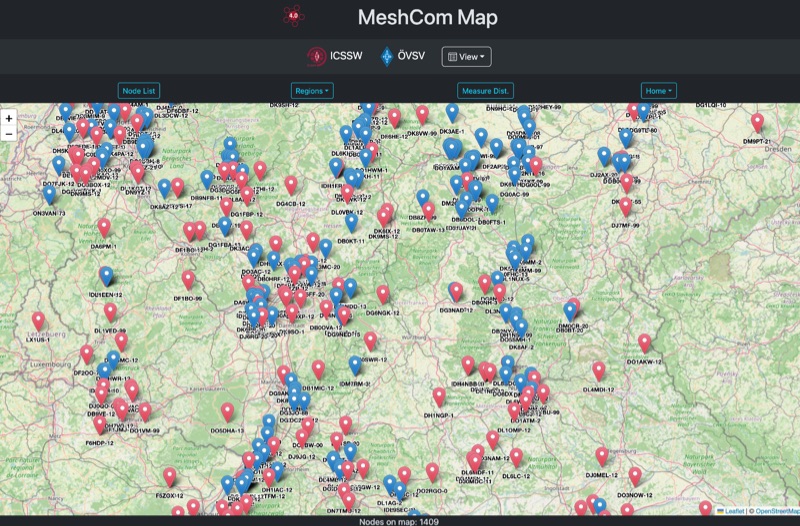 Approximately 100 MeshCom nodes are visualized in real-time on a geographical map, providing a dynamic overview of the LoRa mesh network. This resource, hosted by _OE1KFR_, details node positions, telemetry data, and message traffic. Users can measure distances between two selected nodes, view text messages with callsign, destination, and gateway information, and access position data including latitude, longitude, and altitude. The platform supports filtering by regions such as Europe, USA, and Asia, allowing operators to focus on specific geographical areas. The detailed node list table presents comprehensive status information for each node, including gateway callsign, firmware version, hardware type, and environmental telemetry like temperature, pressure, humidity, and CO2 levels. This granular data enables operators to monitor network health and individual node performance, facilitating troubleshooting and optimization of MeshCom deployments. The map interface enhances situational awareness for those engaged in LoRa mesh networking.
 -
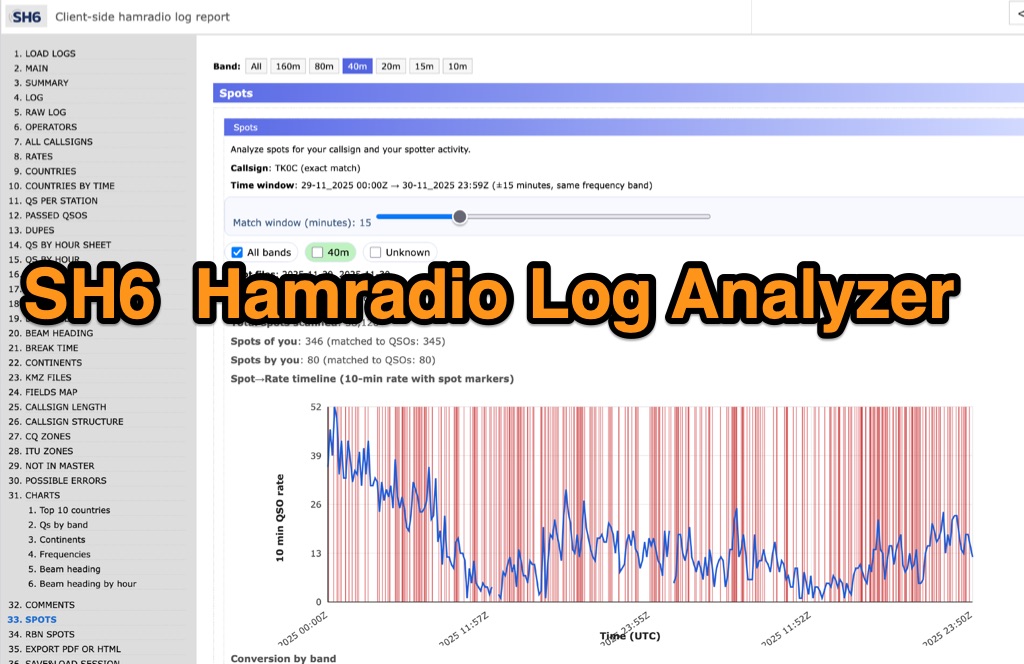 SH6 is a versatile, browser-based utility designed for the detailed analysis and visualization of amateur radio contest logs. Supporting standard formats such as Cabrillo and ADIF, the tool allows operators to upload personal files via drag-and-drop or access a searchable public archive containing over one million logs. Key capabilities include comprehensive performance metrics, offering summaries of band breakdowns, QSO rates, and beam headings. Furthermore, SH6 provides advanced geographic visualization through interactive maps, analyzing contacts by country, zone, and continent. A standout feature is the side-by-side comparison mode, enabling users to contrast two distinct logs for strategic assessment. SH6 transforms raw log data into actionable insights regarding operator performance without requiring software installation.
 -
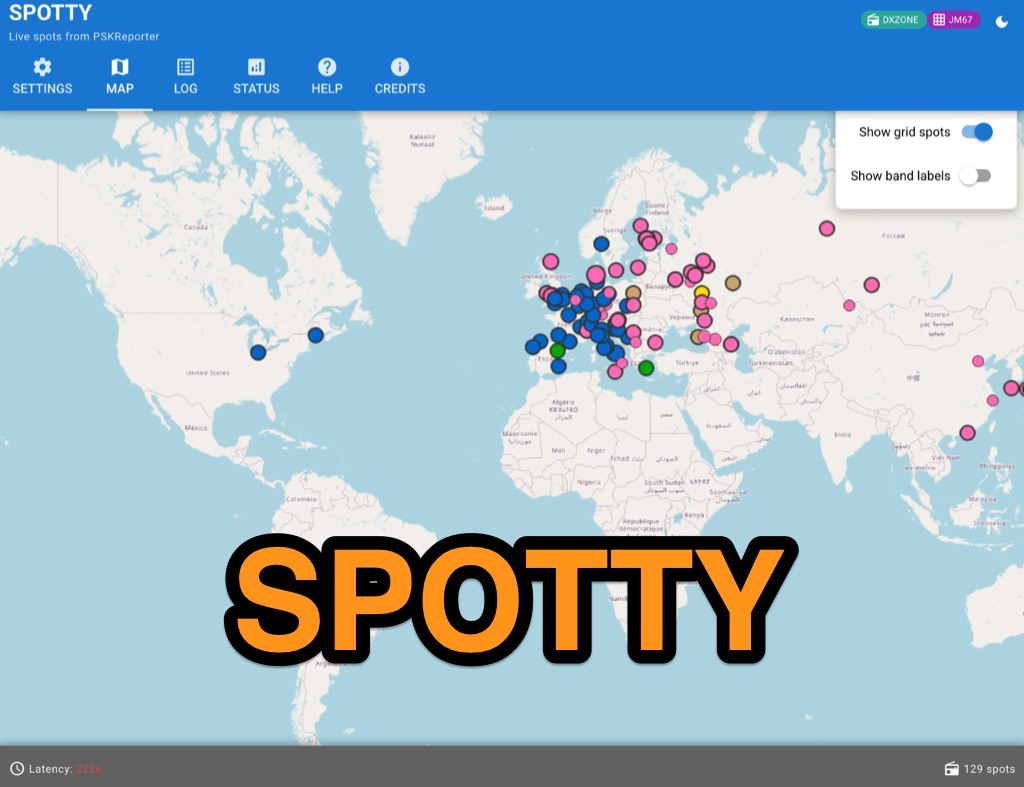 Spotty leverages Philip Gladstone’s pskreporter.info data, delivered via an MQTT broker by Tom Fanning (M0LTE), to offer a responsive web application for visualizing propagation. The Map View presents a default visualization (grid AA00 / callsign MY8CALL) and distinguishes signal types: small spots for signals heard by a location, large spots for transmissions from a location, and teardrop markers for transmissions from the monitored callsign. Clicking a spot reveals detailed signal data in an overlay. The application includes a Log View for raw spot data and a Settings tab for customization. Users can filter tracking by specific Callsign or Grid, with preferences saved to the browser. A notable feature is the Time to Live (TTL) setting, adjustable from the default 60 seconds, which controls spot visibility duration to manage map clutter during high-traffic periods. The tool provides a clear, logic-driven interface for real-time signal monitoring.
 -
 AZIWORLD is a user-friendly tool for generating azimuthal maps of the Earth centered on any location. Compatible with Windows XP and later, it supports English and French. Maps can be saved in .bmp format for easy customization. AZIWORLD computes azimuths, distances, and geographical positions, integrating seamlessly with AZIPOINT for automatic antenna pointing. Linux/Ubuntu/Android users can run AZIWORLD via WINE or CROSSOVER. For optimal functionality, installing AZIPOINT alongside AZIWORLD is recommended.
 -
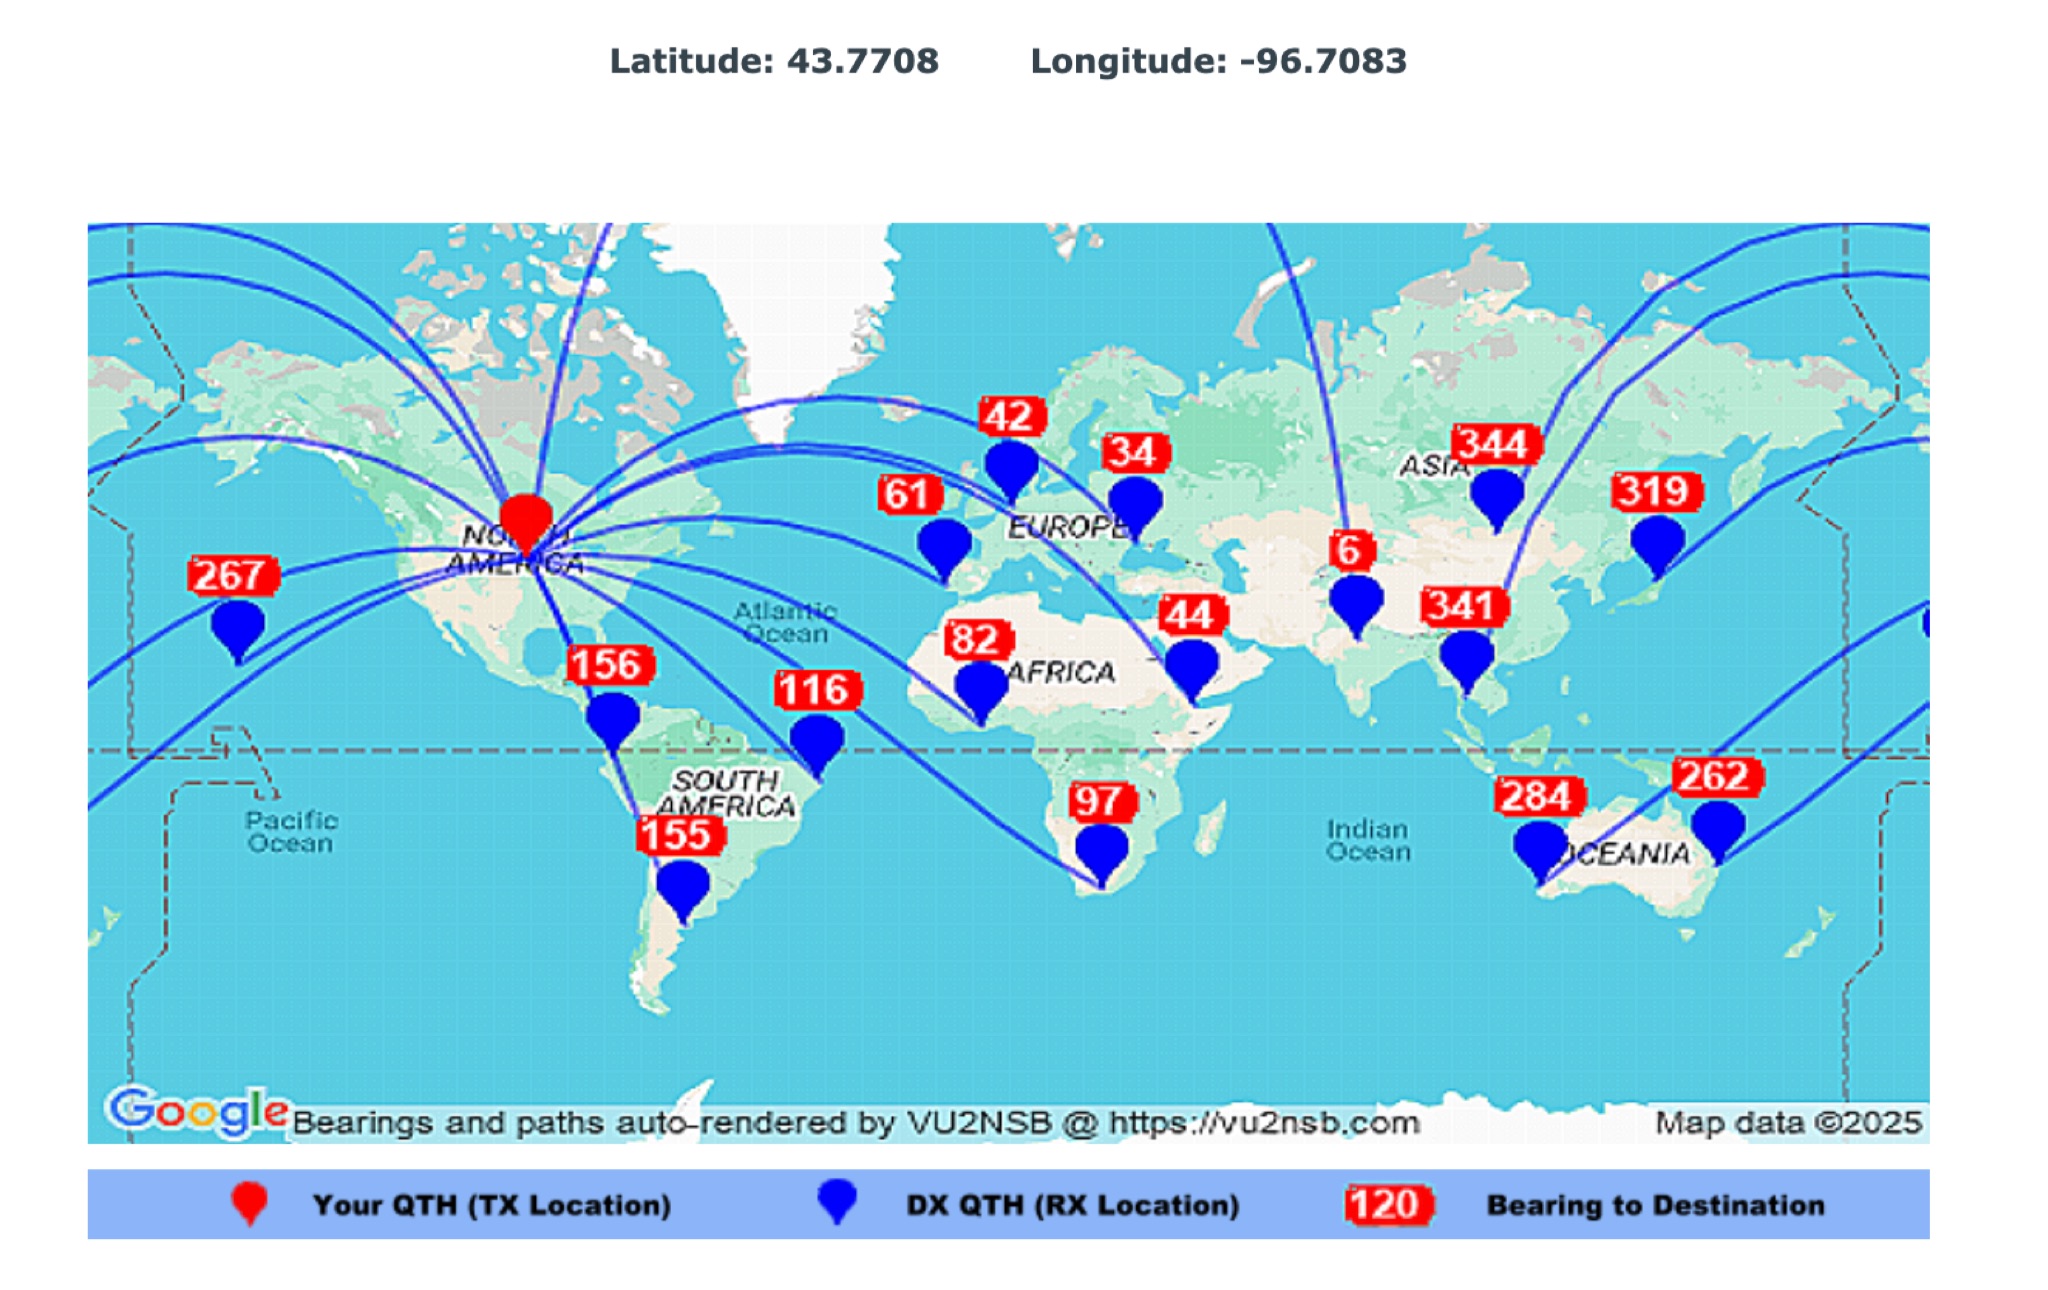 This page by Basu (VU2NSB) presents automatically rendered antenna bearings with geodesic paths projected on a rectangular map. ch geodesic great circle path displayed on the map originates from your location that is derived from your Internet IP address. Therefore the Antenna Bearing Geodesic Map generated below should be accurate and relevant to your physical location (QTH). This map is an alternative to the Great circle Map.
 -
 Open source code to add CQ Zone, ITU Zone and Maidenhead Locator to your leaflet maps.
 -
 A real-time, responsive map view of APRS (Automatic Packet Reporting System) information, CWOP (Citizens Weather Observer Program), and other APRS-IS sources across the world. The N2RWE Real-time APRS Map leverages cutting-edge technologies and custom software to present a dynamic and user-friendly platform for visualizing Automatic Packet Reporting System (APRS) data. This web application aggregates real-time station locations from various public sources, offering a comprehensive view of APRS activity. It caters to both novice and experienced users by providing features like Maidenhead Grid maps, station lists, license plate searches, and advanced tools for geolocation, address lookup, and data analysis. Additionally, the platform integrates with Summits on the Air (SOTA) information, enhancing the experience for SOTA enthusiasts. By actively supporting the #APRSThursday net, the N2RWE Real-time APRS Map fosters a collaborative environment for the APRS community.
 -
 HAMRS v2.52.0 provides a portable logging solution for amateur radio operators, supporting macOS, Windows, Ubuntu, Raspbian, iOS, and Android platforms. The software includes offline databases for POTA parks and US callsigns, facilitating logging without internet connectivity. It features ADIF import/export capabilities, enabling one-click uploads to QRZ.com. Rig control is supported through native _Hamlib_ and _FLRIG_ integration, alongside compatibility with _WSJT-X_ for digital modes. Recent updates in v2.50 introduced a QSO Map for visualizing contacts with band colors and filtering, real-time solar and HF/VHF propagation conditions, and a dedicated logging template for ARRL Field Day exchanges. An interactive US Band Plan displays privileges and sub-bands, while a live POTA Spots Map highlights the active park and offers license-aware spot filtering.
 -
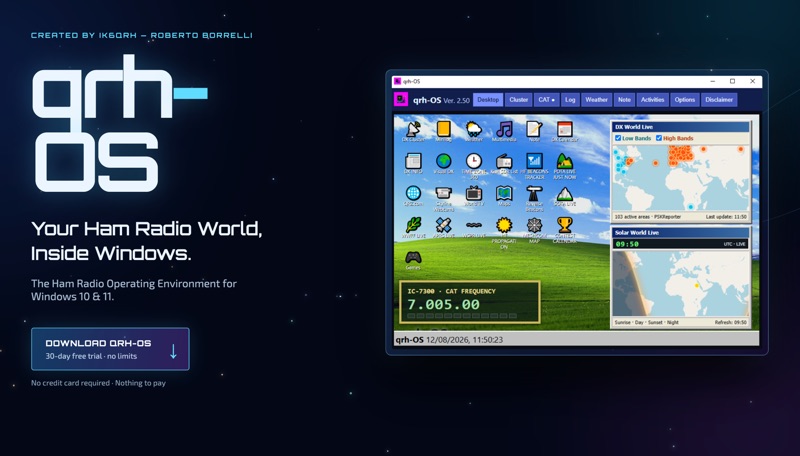 The **qrh-OS** application functions as a dedicated ham radio operating environment within Windows 10 and 11 systems, providing a consolidated platform for various amateur radio activities. It does not alter core system settings but instead presents a virtual desktop populated with specialized utilities and an integrated CAT radio system. This design aims to streamline the operator's workflow by centralizing tools often used for DXing, contesting, and general operating. Key features include a Telnet terminal for DX Cluster connections, real-time APRS tracking, and **CAT control** for transceivers, enabling one-click tuning from various integrated modules like Cluster, POTA, SOTA, WWFF, and Visual DX. The software also incorporates a worldwide Amateur Radio contest calendar, tools for Flora & Fauna activations, and displays for HF Low Bands Beacons and HF propagation conditions. Further utilities encompass a MeshCom Map, POTA Tunable, Reverse Beacons for WSPR network monitoring, SOTA Tunable, and a Timezone display. Visual DX offers an interactive globe showing DX stations and frequencies, while WebSDR/KiwiSDR access extends listening capabilities. An integrated IPTV player and real-time weather maps round out the comprehensive suite, all accessible within a single-window interface.
 -
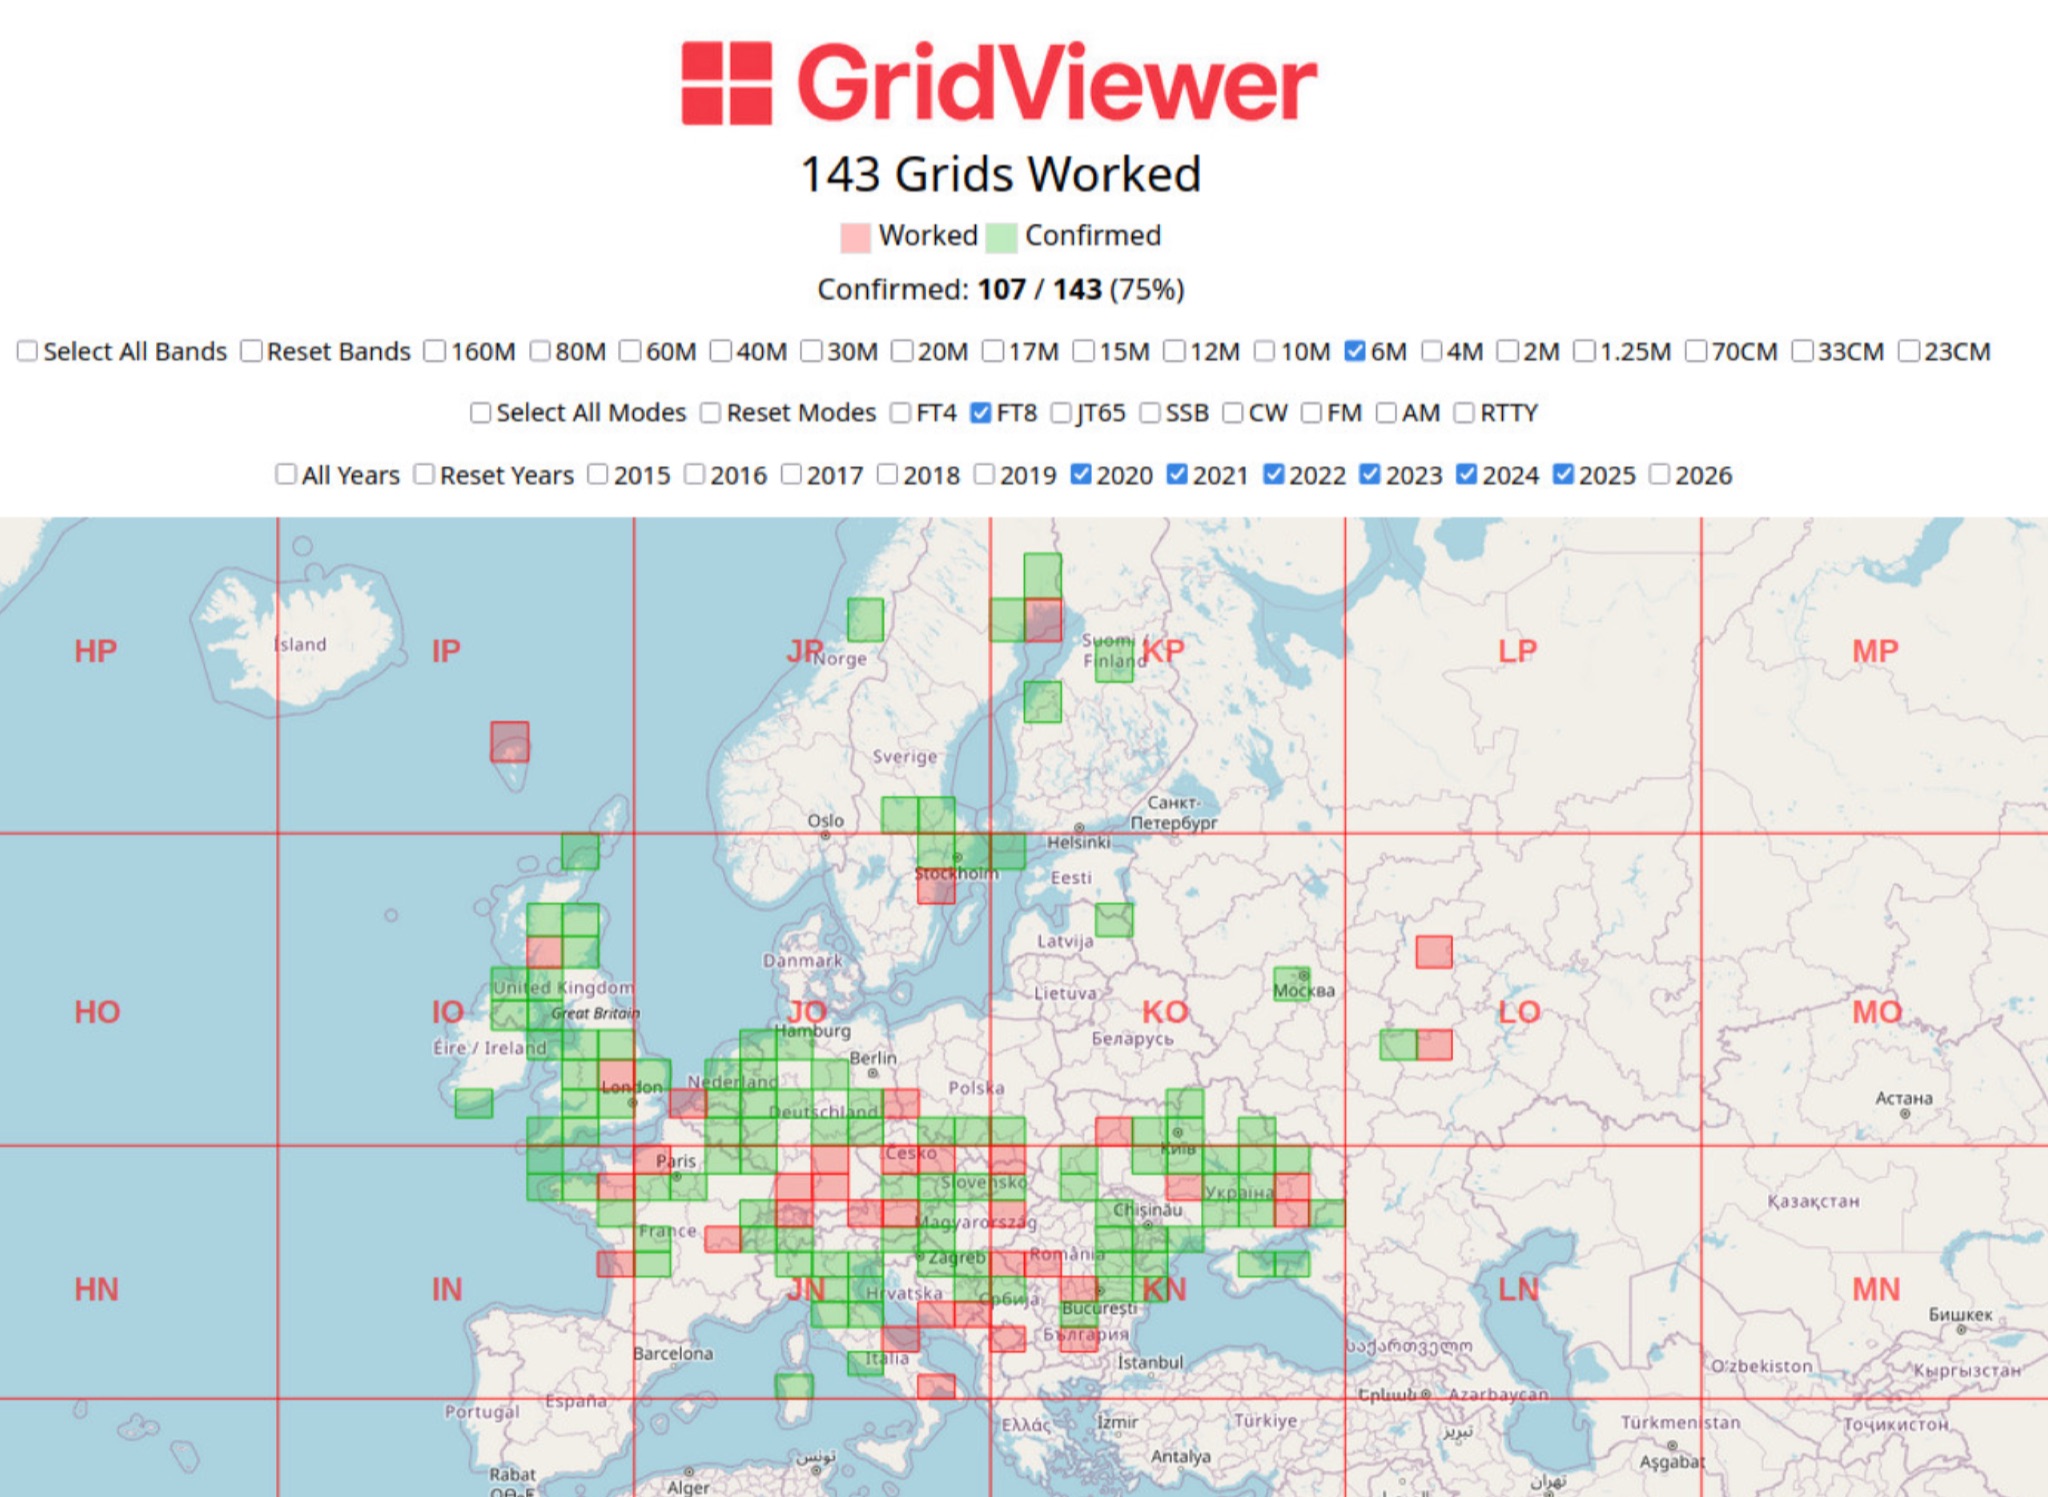 GridViewer is an interactive and lightweight open source web-based tool designed for ham radio operators to visualize and analyze their worked grid squares from ADIF-log files. GridViewer was developed to address a real-world challenge faced by many ham radio operators using lightweight or single-board computers like the Rock 4 SE (in my case) or Raspberry Pi.
 -
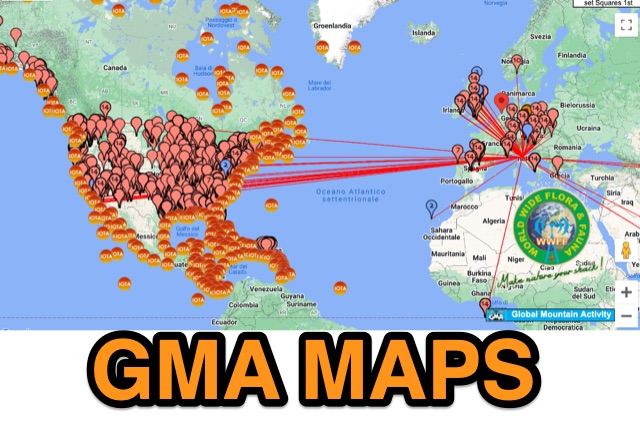 GMA provides an on-line google-map based map with overlays for sota, iota, wwff, lighthouse, mills
 -
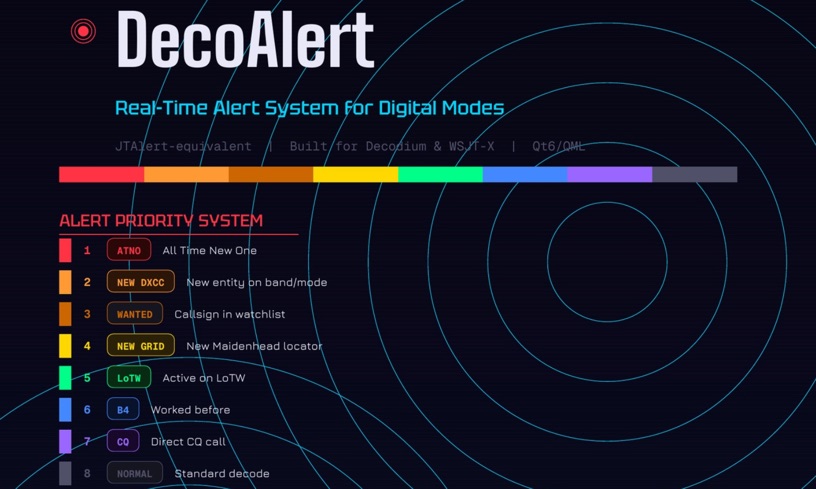 DecoAlert 1.0 Beta is a companion application designed to enhance the digital mode operating experience, specifically for FT8, FT4, and FT2. It operates by monitoring UDP data streams from primary decoding software like _Decodium_ and _WSJT-X_ on port 2237. The software provides real-time, priority-based audio alerts using WAV sounds for various conditions, including All Time New Ones (ATNO), new DXCC entities per band/mode, user-defined watchlist callsigns, new Maidenhead grid squares, and LoTW-active stations. It also highlights previously worked stations (B4) and integrates live DX spots from Telnet clusters, offering a comprehensive suite of tools for serious digital mode operators. The application features a built-in SQLite database for tracking worked stations and integrates with LoTW user lists to identify confirmed contacts. A DX Cluster client supports multiple Telnet servers, providing a broad view of propagation. PSKReporter statistics are available by band and mode, offering insights into signal paths. The QSO log viewer includes search and filter capabilities, while an _OpenStreetMap_ (OSM) interface visualizes spot locations, aiding in situational awareness. DecoAlert requires Windows 10/11 (64-bit) and compatible digital mode software configured to send UDP data.
 -
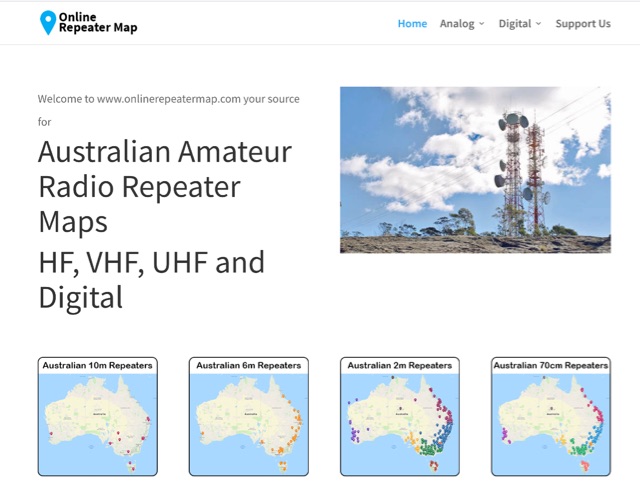 Online Repeater Map aims to help Australian amateur radio operators quickly and easily visualize the location of ham radio repeaters
 -
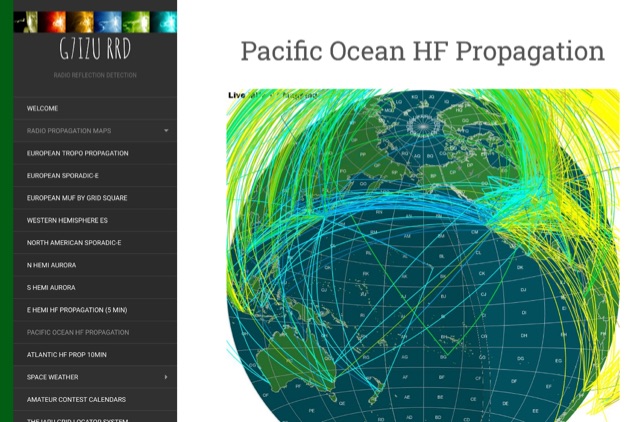 Welcome to the G7IZU Radio Reflection Detection website. This site provides also Live Solar Events, and propagation map
 -
 SWList iOS App, provides access to the EiBi list for discovering and identifying shortwave radio stations, curated by Eike Bierwirth. It offers four search methods: by frequency, radio band, station name, or language. Users can view detailed station information and map locations if available, with support for both light and dark modes.
 -
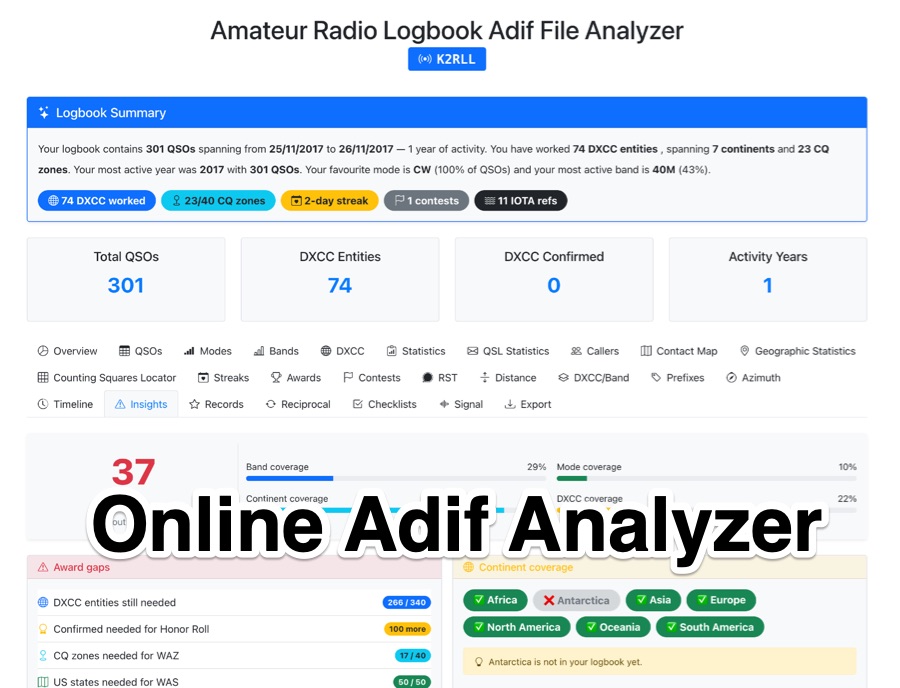 The _Amateur Radio Logbook ADIF File Analyzer_ processes ADIF files locally within the user's browser, ensuring no QSO data is uploaded to a server. It generates a visual map of contacts and detailed statistics across various parameters, including band, mode, time, grid squares, and DXCC entities. The tool offers insights into operating patterns and station performance without requiring any software installation. Users upload their ADIF log files directly, and the analysis is performed client-side, providing immediate results. The output includes charts and graphs that visualize QSO distribution and activity. This approach prioritizes user privacy and data security, as logbook information remains on the user's computer throughout the analysis process. The analyzer supports standard ADIF formats, enabling hams to quickly review their log data for trends and achievements. It is a free, open-source utility designed for general amateur radio log analysis.
 -
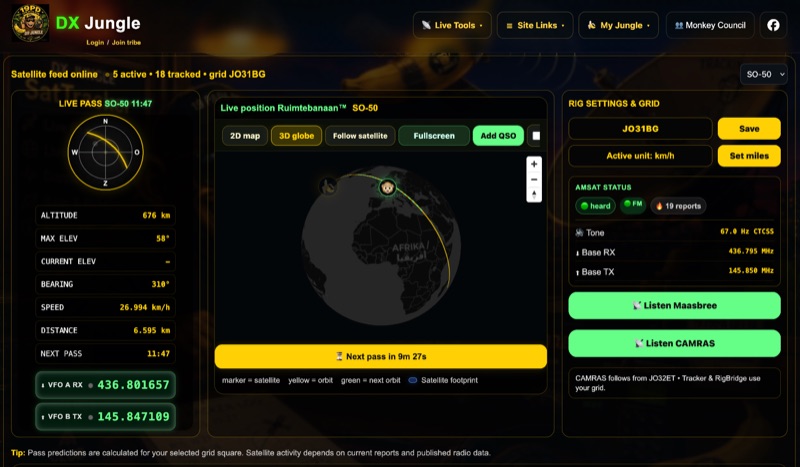 The DX Jungle SatTracker is an interactive online tool designed for real-time amateur radio satellite tracking. It incorporates live Doppler correction, AMSAT satellite status, and pass predictions for various active amateur radio satellites such as ISS, SO-50, FO-29, and RS-44. The platform calculates real-time uplink and downlink frequencies, adjusting for Doppler shift, and displays satellite footprints and orbital paths on a map interface. Users can select specific satellites and input their grid square for localized pass predictions. This service integrates WebSDR support, allowing users to listen to satellite passes live without requiring a physical radio, and offers Companion radio control capabilities. Orbital data is sourced from CelesTrak, while radio frequencies are derived from AMSAT and SatNOGS. The interface provides options to filter for FM repeater-only satellites and displays active passes, ordered by the next available pass, facilitating timely operational planning for satellite enthusiasts.
 -
 This article published on QEX details measurements of tree conductivity and permittivity at HF frequencies, addressing a long-debated topic in amateur radio. N6LF conducted experimental impedance measurements on Douglas fir and maple trees using a vector network analyzer with rings of nails inserted into tree trunks. Results showed that tree conductivity increases with frequency while relative permittivity decreases, similar to soil characteristics. Measured conductivity ranged from 0.06 to 0.4 S/m at 10 MHz, aligning with values used in previous research. These findings validate that NEC modeling can reliably estimate trees' substantial impact on HF antenna performance.
 -
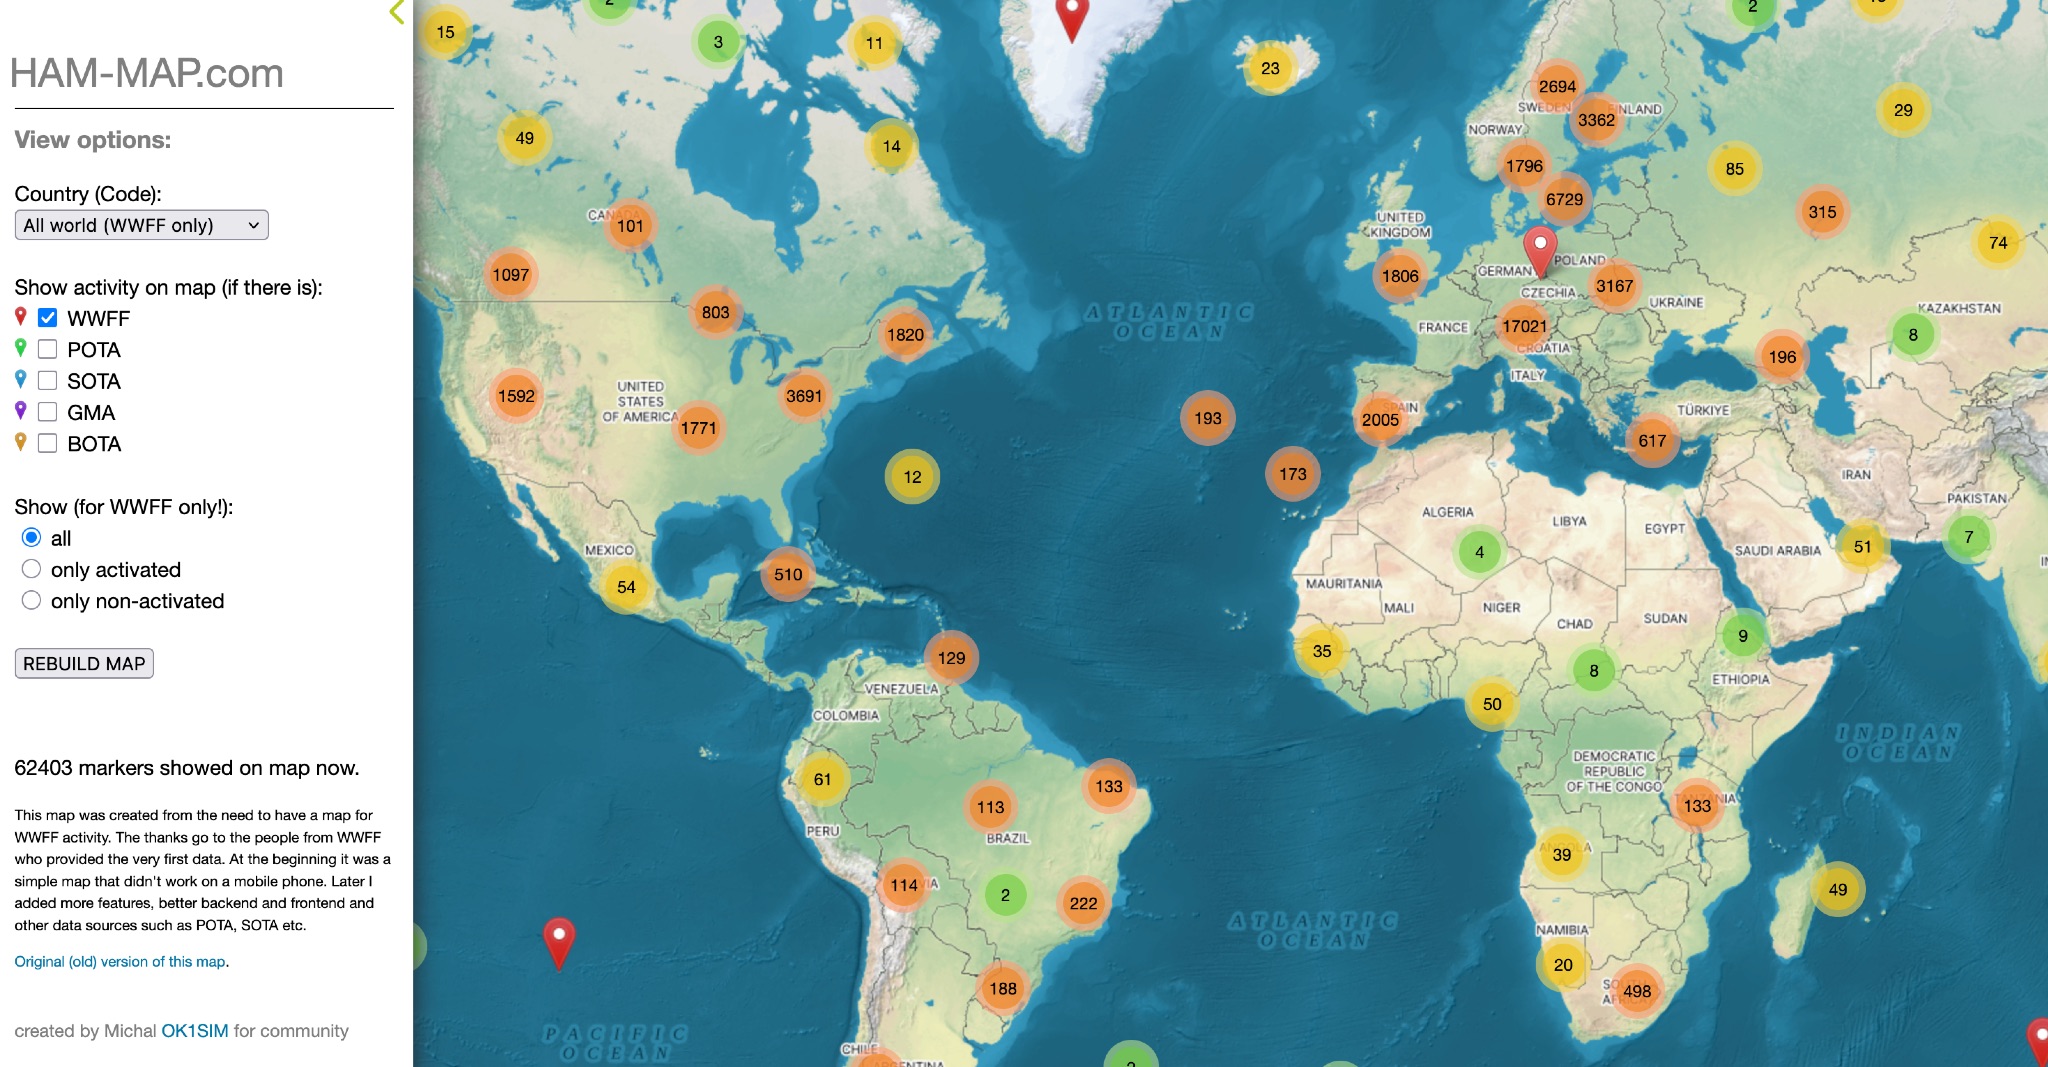 This map was created from the need to have a map for WWFF activity. The thanks go to the people from WWFF who provided the very first data. At the beginning it was a simple map that didn't work on a mobile phone. Later I added more features, better backend and frontend and other data sources such as POTA, SOTA etc.
 -
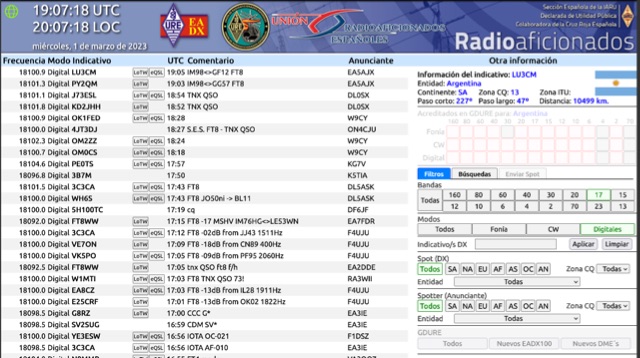 Operating on the HF and VHF bands, the URE WebCluster serves as a real-time DX spotting network for amateur radio operators. It aggregates DX spots from various sources, presenting them with detailed information such as DX callsign, frequency, mode, and spotter details. The platform integrates essential propagation data, including current solar indices like _K-index_ and _A-index_, alongside visual propagation maps, which are crucial for planning long-distance contacts. Users can submit new DX spots, contributing to the collective intelligence of the amateur radio community, and filter existing spots by band, mode, or callsign, enhancing operational efficiency. This resource enables operators to monitor band openings and identify active DX stations, significantly aiding in _DXCC_ pursuit and contest operations. The integration of solar-terrestrial data directly within the cluster interface allows for immediate correlation between propagation conditions and observed DX activity, a feature not universally present in all web clusters. By providing both raw spot data and contextual propagation information, the URE WebCluster offers a practical tool for real-time decision-making during operating sessions, allowing hams to quickly adapt to changing band conditions and target specific _DX_ entities.
 -
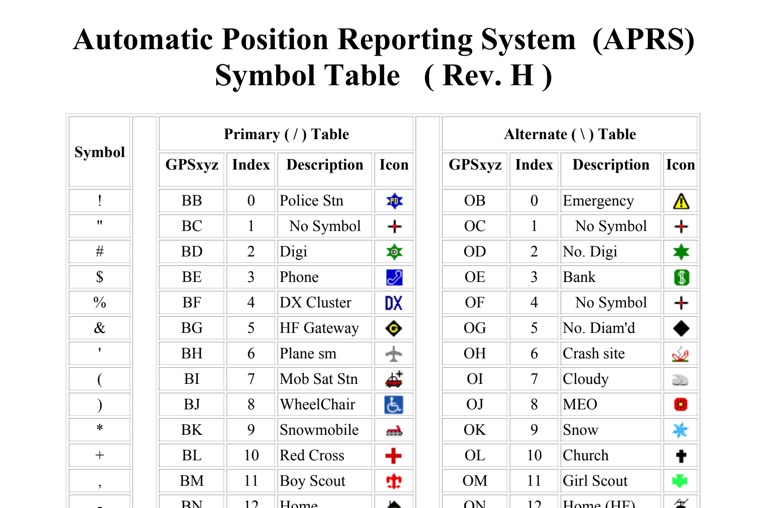 The four-page _APRS Symbol Table_ (Revision H) systematically lists 96 primary and 96 alternate Automatic Packet Reporting System symbols, each with its corresponding GPSxyz Index, a concise description, and a visual icon. For instance, the primary symbol '!' (GPSxyz BB) represents a "Police Stn," while its alternate counterpart '!' (GPSxyz OB) signifies "Emergency." The resource clearly delineates how specific ASCII characters map to distinct graphical representations on APRS displays, crucial for accurate situational awareness. It presents a direct, tabular format, making it an efficient reference for operators needing to quickly identify or interpret the myriad of icons used in APRS mapping applications. The table covers a broad spectrum of common APRS entities, from fixed stations like "Digi" (#) and "Home" (-) to mobile units such as "Car" (>) and "Plane sm" ('), alongside various weather phenomena and emergency services. Compiled by VK4KTP and featuring images by WA8LMF, the document serves as a definitive guide for understanding the visual language of APRS. It is particularly useful for those involved in tactical communications, public service events, or general APRS tracking, ensuring consistent symbol interpretation across different platforms and user interfaces.
 -
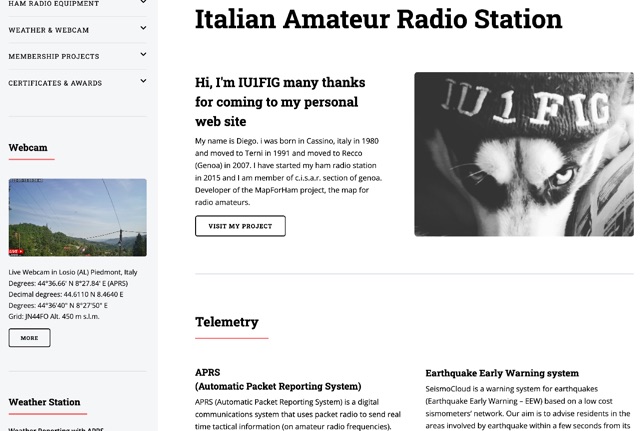 My name is Diego, I was born in Cassino, italy in 1980 and moved to Terni in 1991 and then to Recco (Genoa) in 2007. I have started my ham radio station in 2015 and I am member of c.i.s.a.r. section of Genoa. Developer of the MapForHam project, the map for radio amateurs.
 -
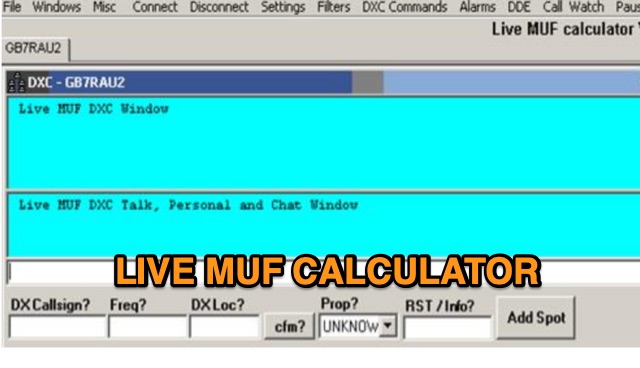 Live MUF is a DXC (cluster) telnet client which attempts to resolve propagation modes from spots and also attempts to calculate sporadic e possibilities purely based on incoming data from the cluster. It has great circle mapping (GCM) built in to the app for live mapping of spots. Live MUF also can be used as a world wide converse telnet client, ON4KST telnet client and DXC at the same time. Live MUF also has basic logging capabilities in case you need an emergency logger at any time.
 -
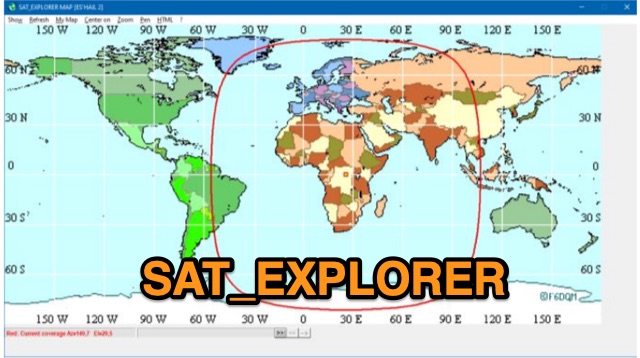 SAT_EXPLORER is a versatile software for tracking the Moon, Sun, and artificial satellites while controlling various antenna interfaces. Compatible with Windows XP and later (32/64-bit) and multilingual (English, French, German, Italian, Spanish), it integrates seamlessly with TRX-Manager for transceiver control. SAT_EXPLORER computes satellite and Moon positions with high precision, calculates EME Doppler shifts, and uploads real-time satellite positions and coverage maps to your personal web pages. Linux/Ubuntu users can run it using WINE or CROSSOVER.
 -
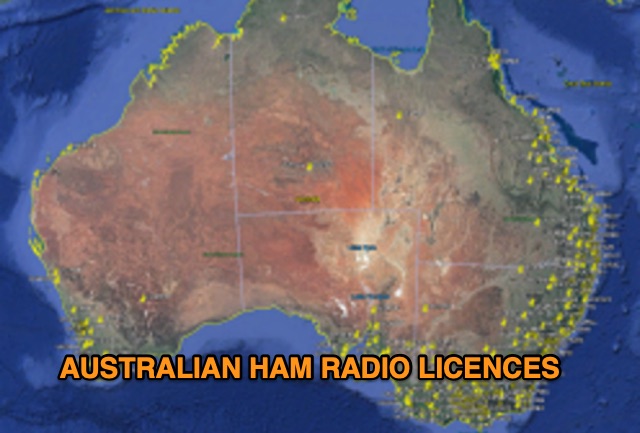 Discover a comprehensive solution for mapping Australian ham radio entities using data from the ACMA Public Register. This tool, developed in Delphi 7, generates KML files for Google Earth, showcasing repeaters, beacons, and operators across different prefixes. While respecting privacy regulations, the files provide valuable insights into the amateur radio landscape.
 -
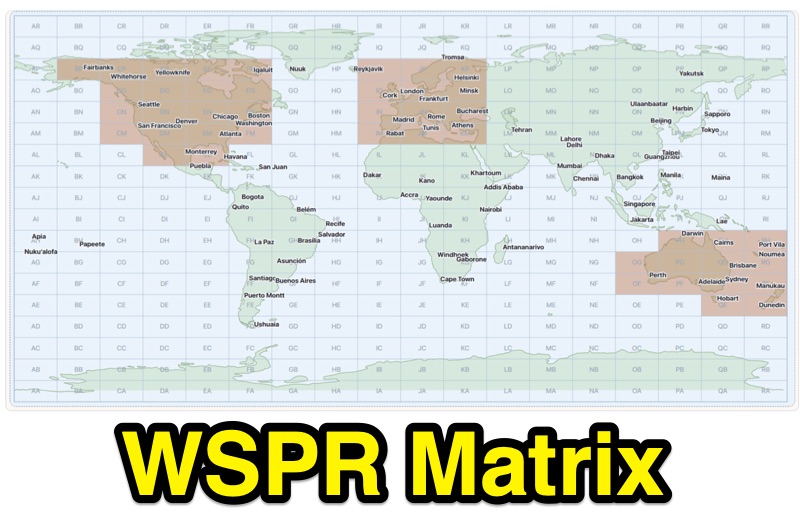 Demonstrates WSPR propagation activity, presenting observed data by reporter, band, UTC time, local time, and user-selected global destination areas. The application allows users to analyze WSPR spots from a live data server or import saved WSPRnet query files, bypassing the 10,000-row download limit by collecting individual band files for busy bands. Users can configure band preferences and destination modes, choosing between city radius or Maidenhead map grids for filtering path destinations. The interface provides options to start current-day live collection, a 7-day continuous archive, or load previously saved data to build the propagation matrix. Diagnostic information and archive history are accessible, alongside map setup controls for grid contrast and visibility. The tool supports both Path 1 and Path 2 map destinations, enabling detailed analysis of WSPR signal paths.
 -
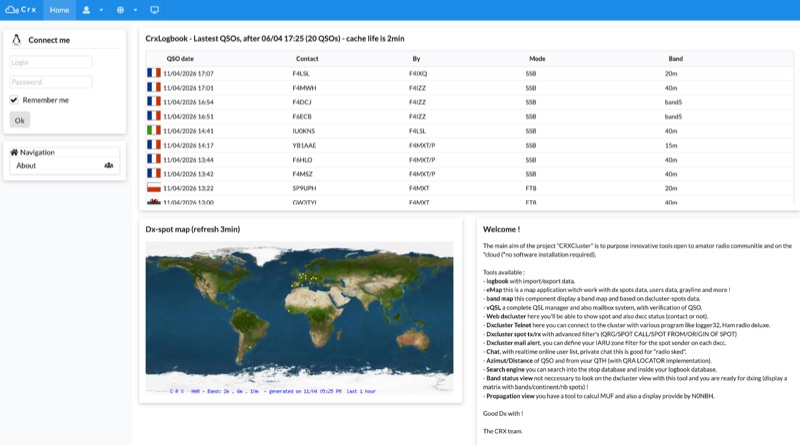 Demonstrates a cloud-based suite of tools for amateur radio operations, eliminating local software installation. The platform integrates a comprehensive logbook with import/export functionality, an _eMap_ application displaying DX spots, user locations, and grayline data, alongside a dynamic band map derived from DX cluster information. It also provides a _vQSL_ system for QSL management and a mailbox with QSO verification. Users can access a Web DX cluster to monitor spots and _DXCC_ status, or connect via Telnet using external programs like _Logger32_ or Ham Radio Deluxe. The cluster supports advanced spot filtering by QRG, spot call, spot from, and origin, with configurable mail alerts based on IARU zone filters. Additional features include a real-time chat for skeds, azimuth/distance calculations from a user's QTH (with QRA locator), a search engine for spot and logbook databases, a band status matrix, and a propagation tool for MUF calculations, leveraging data from N0NBH.
 -
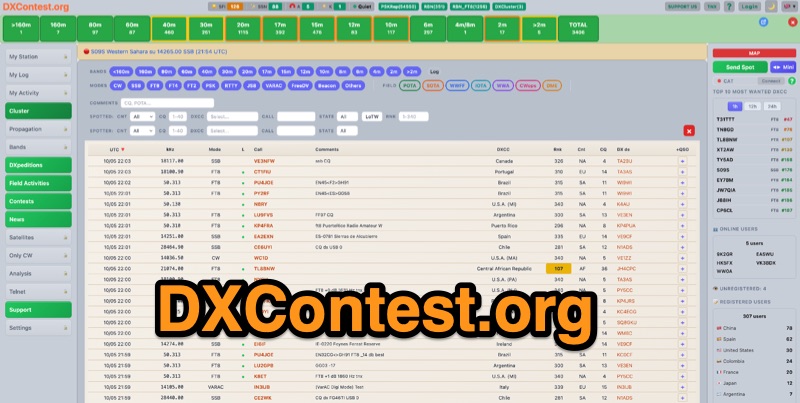 DXContest.org provides a real-time DX cluster, integrating advanced spotting capabilities with features like _propagation maps_, _PSKReporter_, and the _Reverse Beacon Network_. This platform enables radio amateurs to monitor DX activity, apply sophisticated filters to spot data, and even utilize CAT control for their transceivers directly through the web interface. The service is designed for immediate utility, offering free access without requiring user registration. Users can send DX spots, control their radio via CAT, and consult a contest calendar. The platform also provides traditional Telnet access for those preferring client-based cluster interaction. Developed by Pascual R. Salas Vidal, EA5WU, the service aims to be a comprehensive tool for real-time DX operations and contest participation, offering a blend of modern web features and classic cluster functionality.
 -
 This page showcases the use of ChatGPT for quickly creating a prototype application that maps out individual QSOs from a CZML map. The author details the process of using ChatGPT to generate code that positions and frames a Cesium Ion map based on data from a czml file. The page includes links to the original map, the prototype app, a video demonstration, and the mapped QSOs output. The content is aimed at hams interested in experimenting with AI tools for ham radio applications.
 -
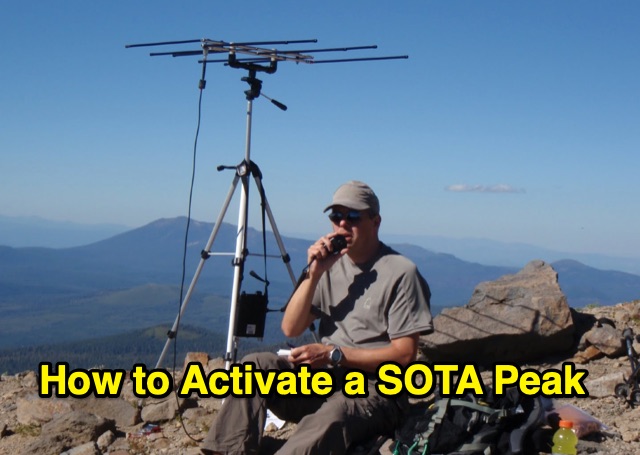 Outlines the essential steps for successfully activating a **Summits on the Air (SOTA)** peak, providing a structured approach for amateur radio operators participating in this popular award program. It details crucial pre-activation planning, including navigating the SOTA website, setting up a SOTA Data account, and consulting the **Association Reference Manual (ARM)** for specific regional rules and peak information. The guide also covers using mapping resources like adventureradio.de and lists ofjohn.com to identify suitable summits and check access conditions. The document emphasizes safety during the activation, advising operators to monitor weather, carry rain gear, and plan ample time for the ascent and descent. It specifies the **4-QSO minimum** requirement within the Activation Zone and recommends calling "CQ SOTA" on traditional QRP or VHF calling frequencies. The guide also suggests using local 2m FM repeaters for safety communications and spotting, while clarifying that repeater QSOs do not count for SOTA points. Post-activation activities include submitting logs to sotadata.org.uk, uploading trip reports to share experiences with future activators, and promoting SOTA participation on various reflectors. The guide highlights the program's appeal through its awards system for both activators and chasers, encouraging new participants in North America.
 -
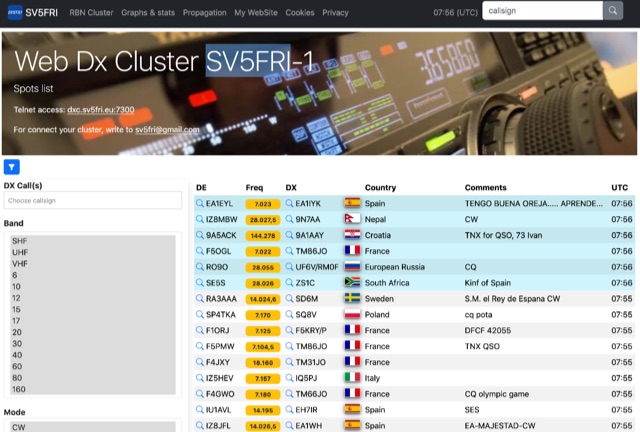 Operating a web-based DX cluster, this resource presents real-time amateur radio DX spots, facilitating contact logging and propagation analysis. It leverages the Spiderweb platform, offering users the ability to filter DX spots based on various criteria, including inclusion and exclusion rules. The interface integrates directly with QRZ.com for immediate callsign lookups, displaying flag icons for geographical context, and provides charts and statistics derived from spot data. Further enhancing its utility for DXers and contesters, the cluster includes direct links to MUF (Maximum Usable Frequency) maps and HamQSL solar condition reports. These external data sources provide critical propagation insights, assisting operators in making informed decisions about band selection and operating times. The service also offers Telnet access at dxc.sv5fri.eu:7300 for those preferring a command-line interface.
 -
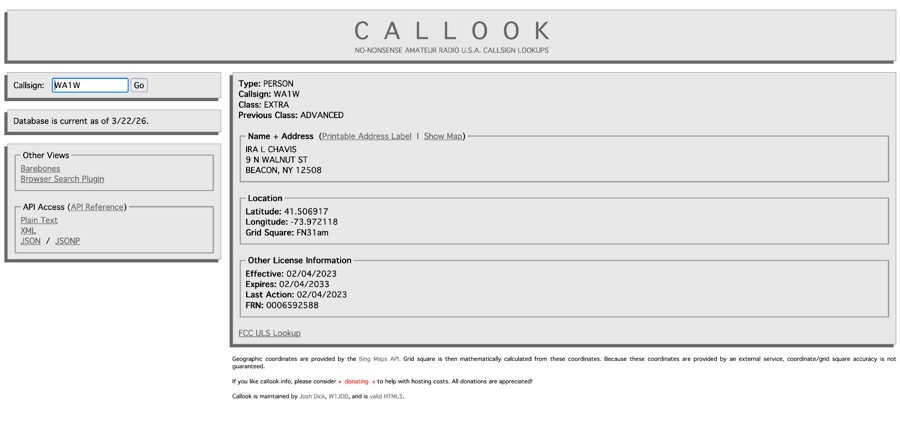 Callook provides a **USA amateur radio callsign lookup service** with data current as of March 25, 2026. The platform allows users to search for valid callsigns and retrieve detailed information, including geographic coordinates sourced from the Bing Maps API. A mathematically calculated **grid square** is derived from these coordinates, though accuracy is not guaranteed due to reliance on external services. The service supports multiple access methods, including a browser search plugin, direct API access with a reference, and plain text output for integration into other applications or scripts. This tool facilitates rapid identification of US amateur radio operators, offering an alternative to other callbook services. Its API access enables developers to integrate callsign lookup functionality into custom applications, streamlining data retrieval for logging software or contest management. The direct presentation of FCC data, combined with grid square calculation, assists DXers and contesters in verifying contact information and location details during on-air operations.
 -
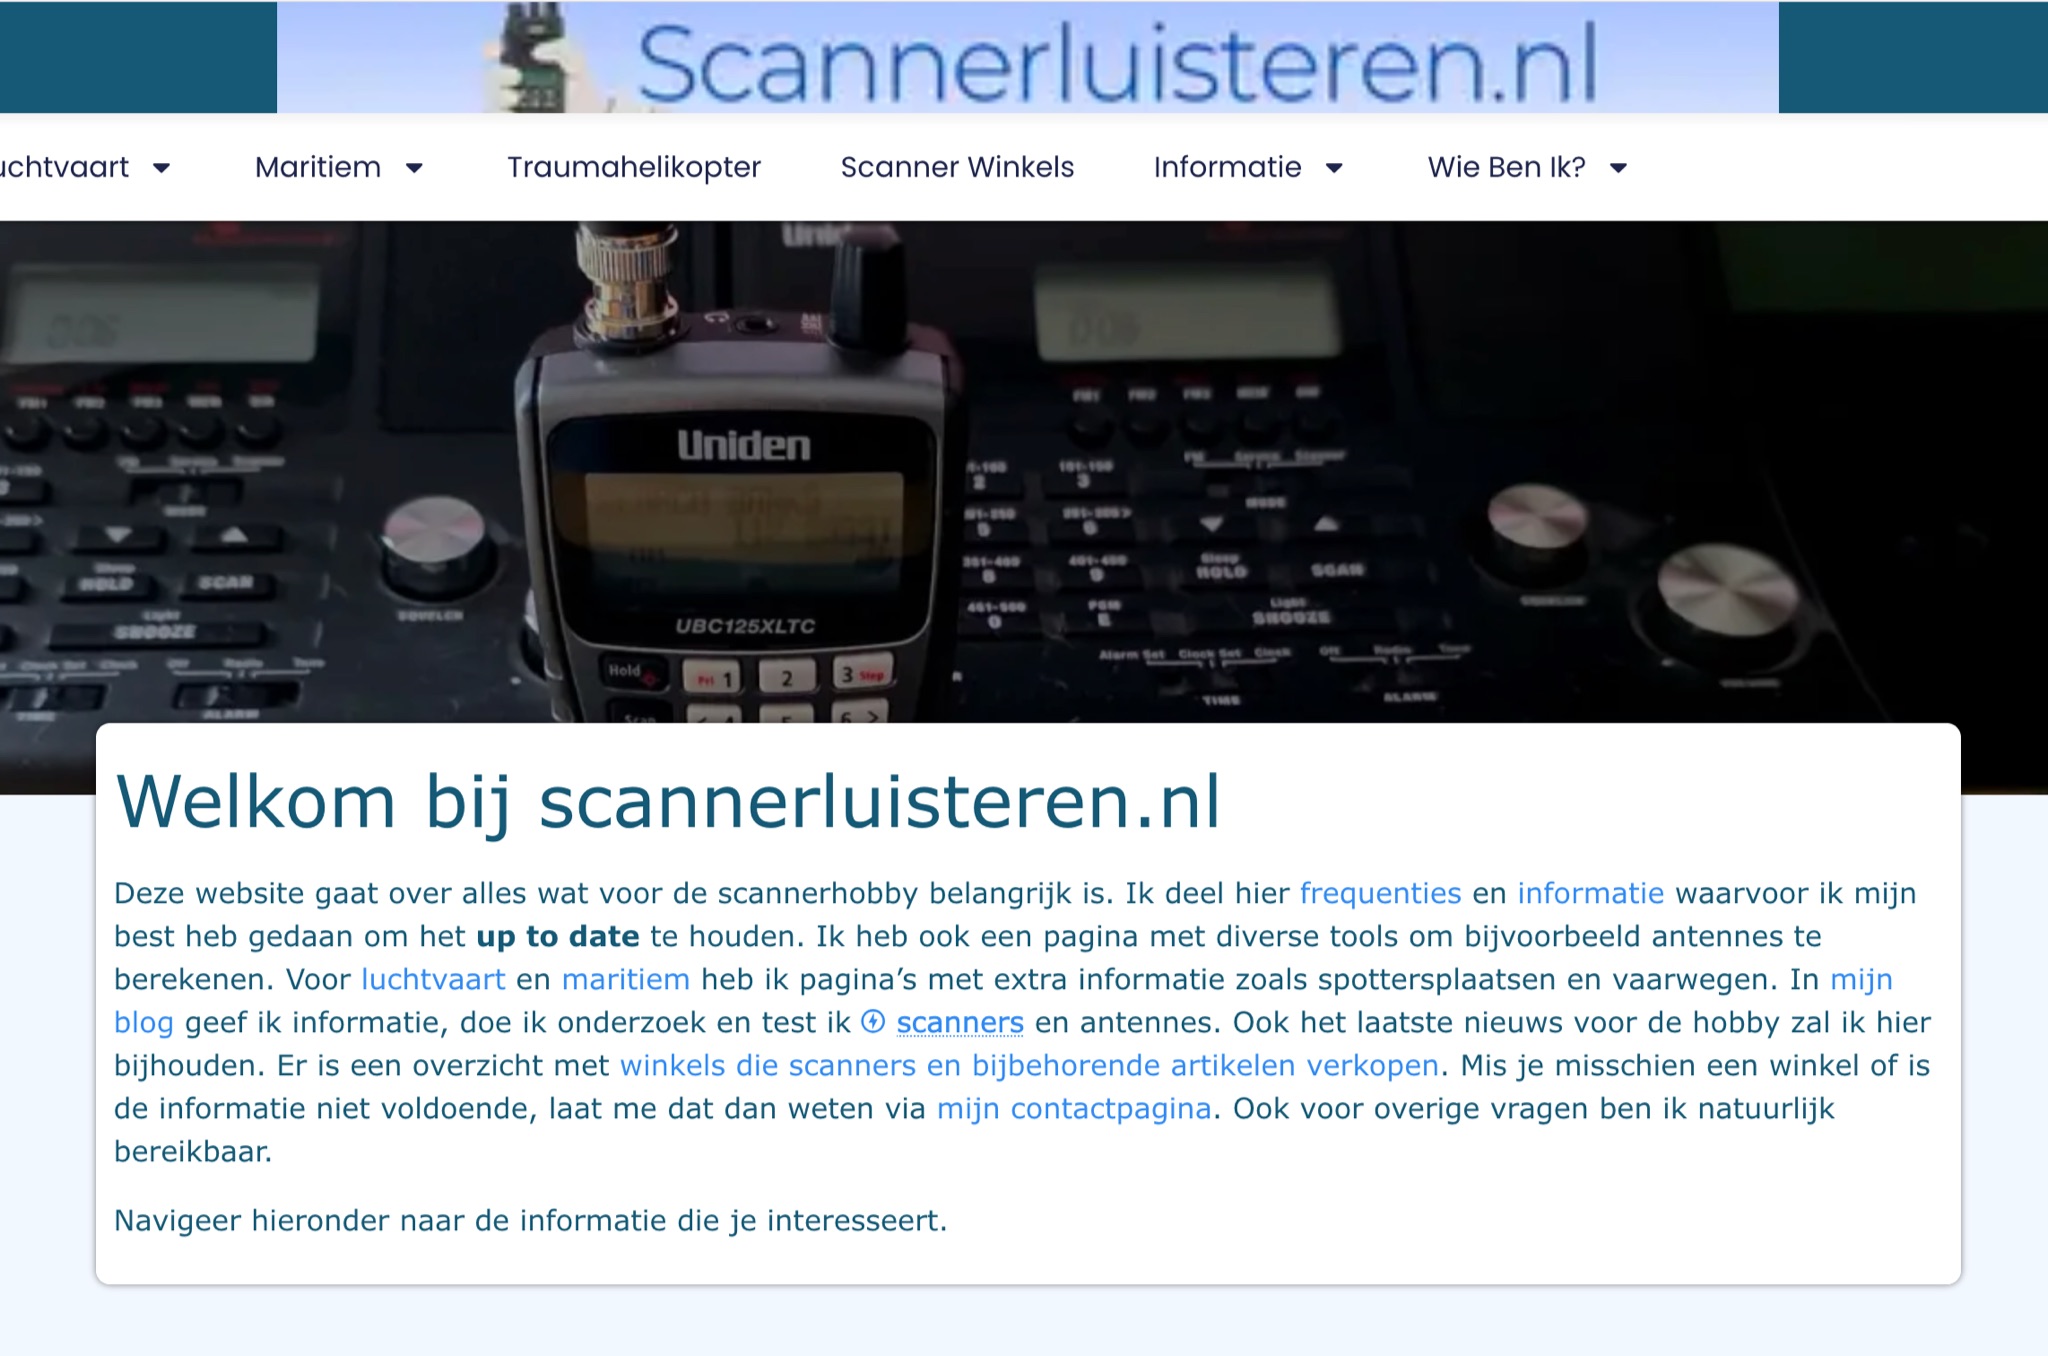 A Dutch website, with a translation option, about scanner radios, maritime, and aviation communication. With maps,a blog, free tools and calculators, and a large collection of Dutch frequencies.
 -
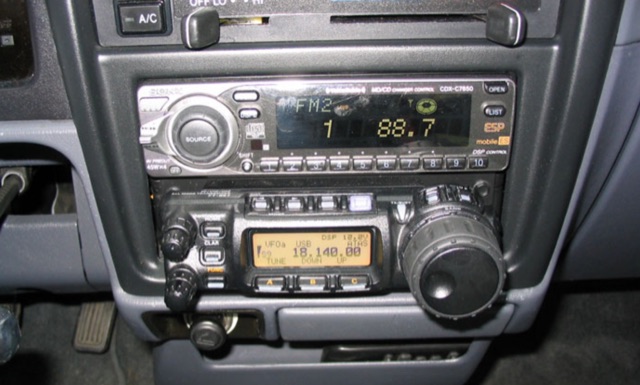 Detailing a Yaesu FT-857 and ATAS-120 installation in a 1997 Toyota Tacoma, the author used Polar Plot to map signal strength. Using a hand truck with a laptop, FT-817, and an Iron Horse antenna, they circled a chalk-outlined 100-foot diameter, revealing potential nulls towards the truck's rear and through the cab, offering insights into antenna performance.
 -
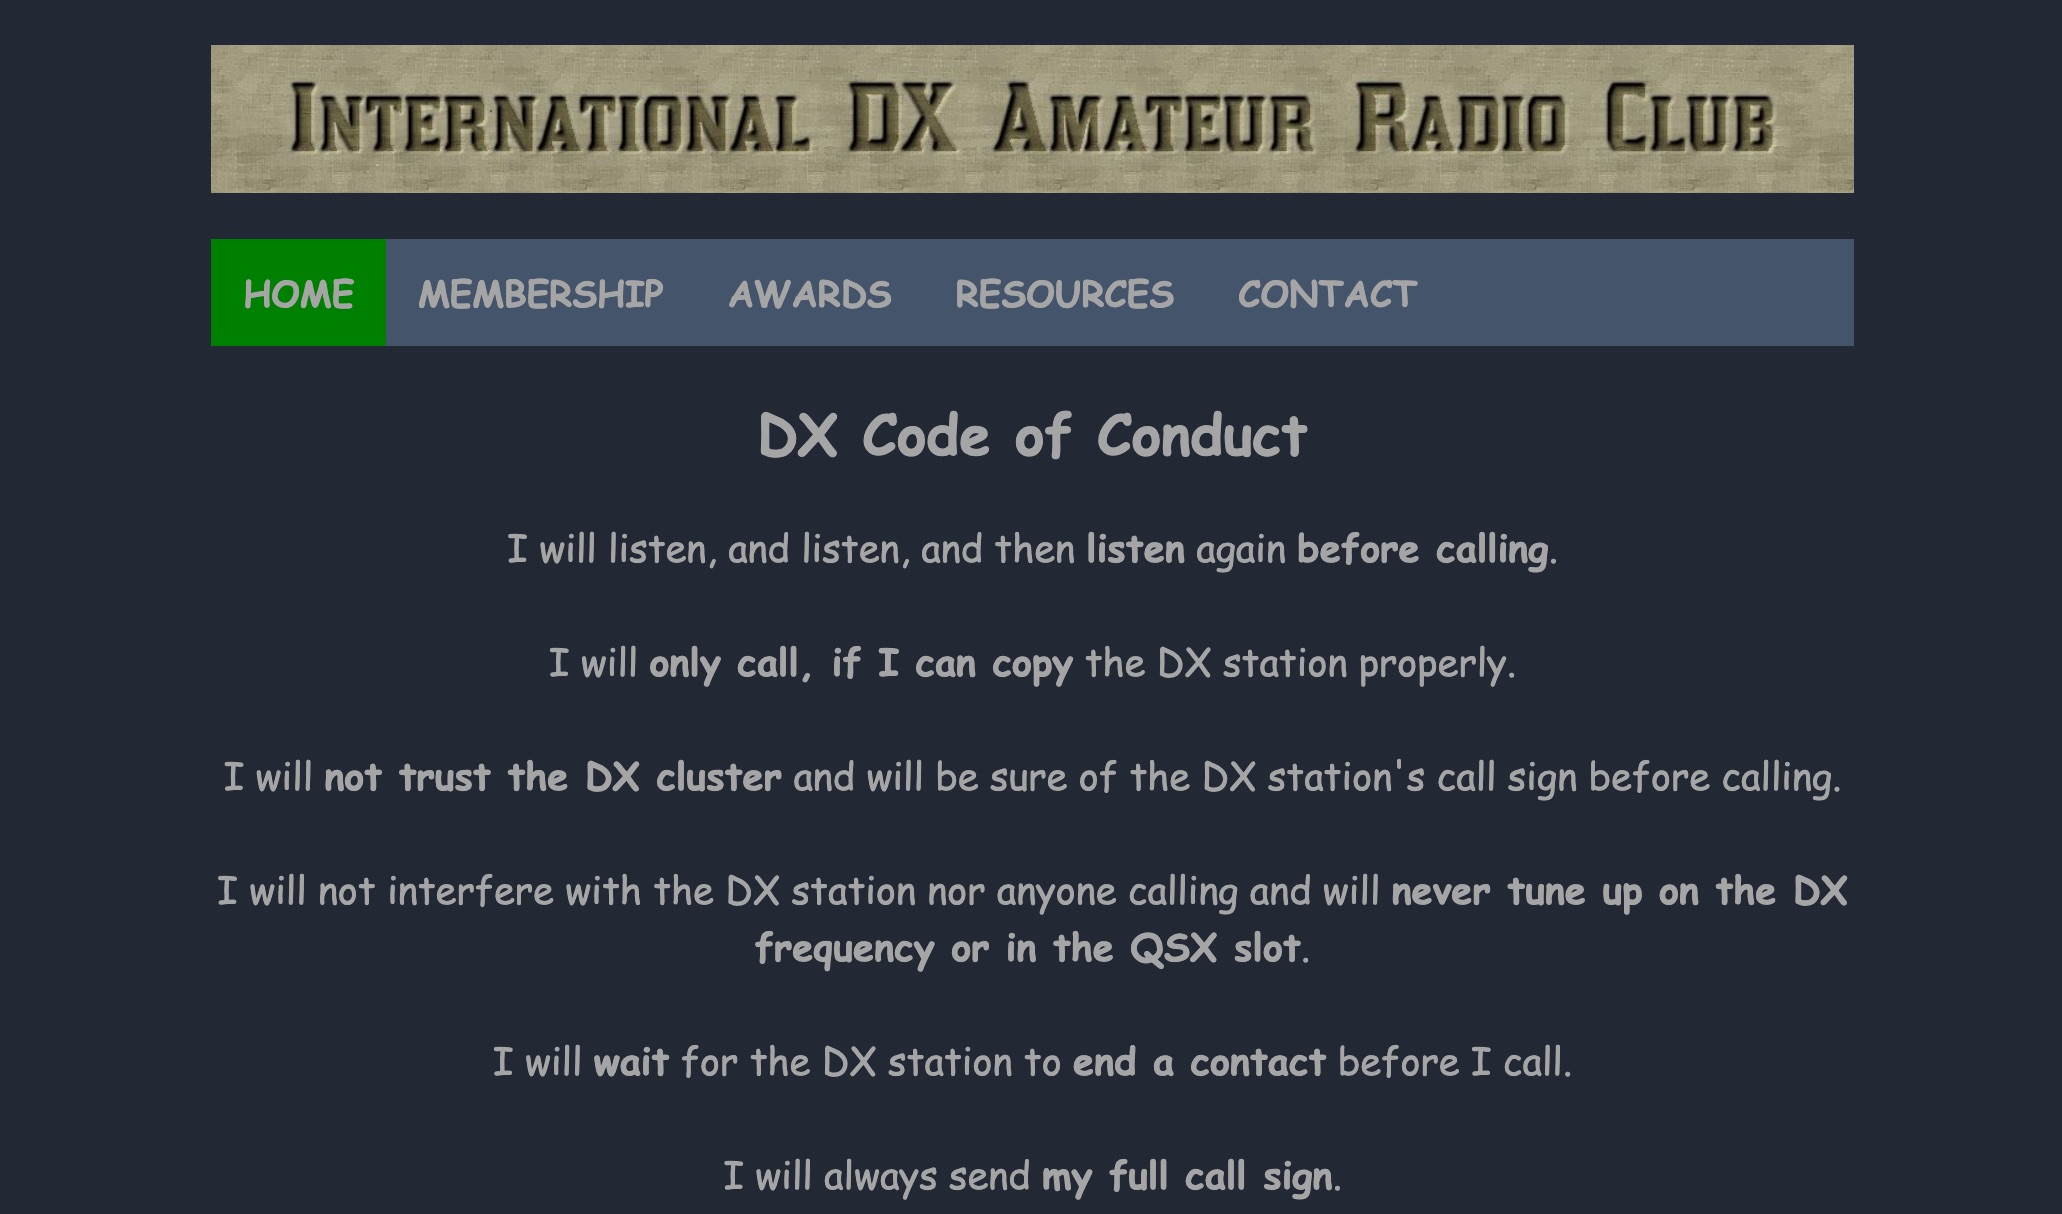 The International DX Amateur Radio Club provides a structured environment for amateur radio operators interested in long-distance communication. The club offers a variety of awards, including the DX Countries Award, DX United States Award, and DX Continents Award, among others. These awards recognize achievements in contacting stations across different geographical areas, such as Europe, Africa, South America, and Asia. The club also supplies resources like DX Spots, Grey Line Map, and Solar Data to assist operators in optimizing their communication strategies. The DX Code of Conduct emphasizes disciplined operating practices. Operators are encouraged to listen carefully before transmitting and ensure they have correctly identified the DX station's call sign. The guidelines advise against interfering with ongoing communications and stress the importance of patience, such as waiting for the DX station to complete a contact before calling. Operators are reminded to send their full call sign and avoid continuous calling, maintaining respect for fellow operators to foster a cooperative amateur radio community. DXZone Technical Profile: DX Awards | DX Code of Conduct | Grey Line Map
 -
 LZ QSL printing serivice have more than 25 years experience with QSL printing. First started as Gold Print Service in 1997 presented by LZ3HI. It provides other printed products for commercial or personal use such as Amateur Radio World Map, Eyeball cards, Business cards, Calendars, Posters, Flyers, Pens etc
 -
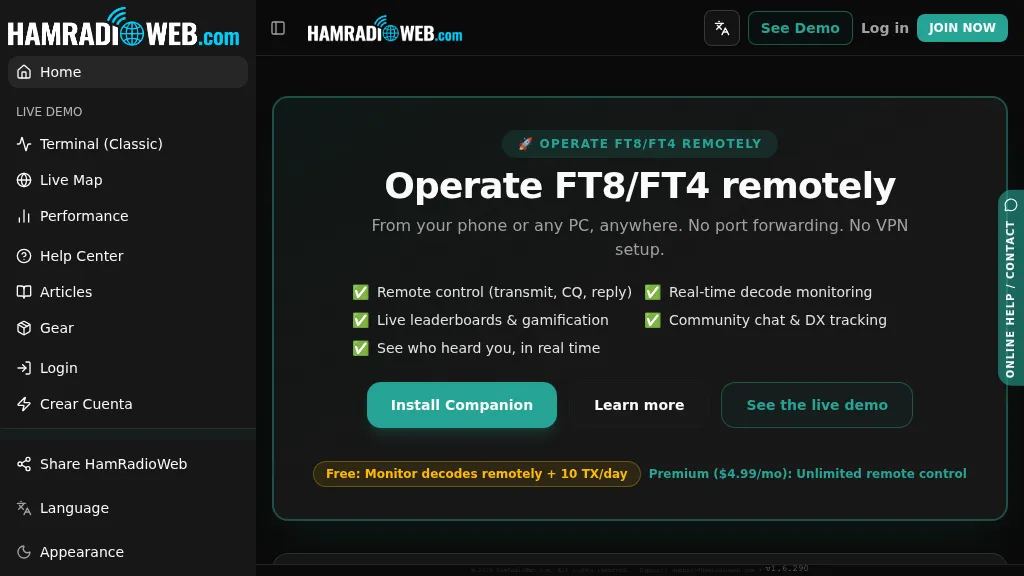 Provides a real-time intelligence layer for **WSJT-X** and **JTDX** operators, enhancing weak-signal digital mode operations. It enables remote monitoring of decodes and transmit control for FT8 and FT4 from any browser or device, eliminating the need for port forwarding or VPNs. The platform integrates with PSKReporter data to compare a station's signal-to-noise ratio (SNR) against nearby operators receiving the same signal, offering immediate feedback on propagation and station performance. Operators can track DXCC entities, grid squares, CQ/ITU zones, and WAC status in real-time through an integrated logbook. A live global band-activity map visualizes who is decoding a station's transmissions, providing tactical intelligence updated every 15 seconds. The system also includes social features like community chat, allowing operators to share station metrics and engage with others. The Companion app, a small bridge application, runs on the shack PC, facilitating seamless remote access and control. This setup transforms the weak-signal operating experience by providing actionable data and real-time insights into propagation openings and station effectiveness.