Search results
Query: propagation map
Links: 56 | Categories: 2
-
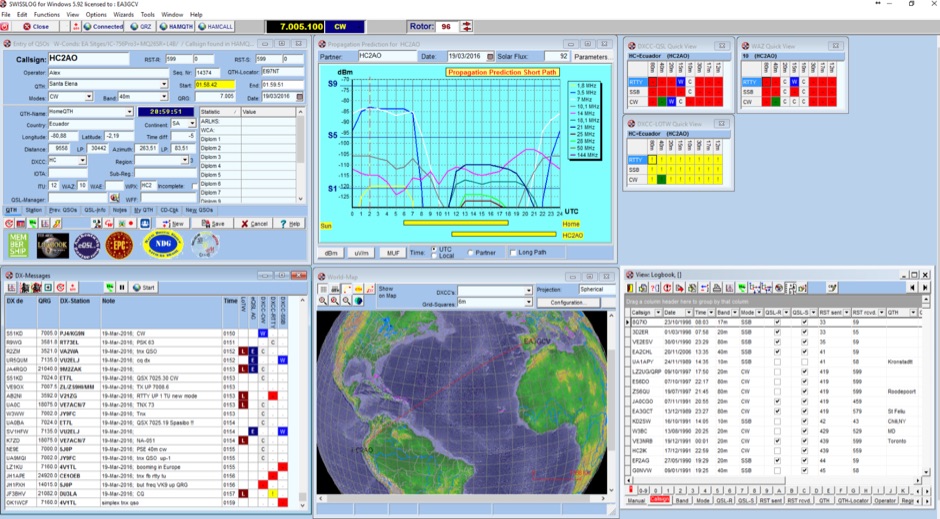 Swisslog, a robust freeware logging program, integrates seamlessly with various external devices and online services, making it a central hub for station operations. My field experience with similar logging software confirms the critical importance of features like real-time logging to services such as eQSL, QRZ, and Club Log, which Swisslog supports with both upload and download synchronization. The program also offers comprehensive award tracking for approximately 150 built-in awards, with the flexibility to add more, alongside detailed statistical reports. Beyond basic logging, Swisslog provides advanced functionalities like direct interfacing with popular digital mode software including WSJT-X, JTDX, and FLDIGI, ensuring accurate and rapid QSO entry for FT8 and other modes. It also supports multiple transceiver control (up to 8) from major manufacturers like Yaesu, Kenwood, and ICOM, and integrates with rotor control systems such as ARS-USB and Hy-Gain DCU. The _DX-Cluster_ integration is particularly useful, displaying spots with real-time award status and automatic detection for SOTA, POTA, and WFF from spot comments, which can significantly improve DXing efficiency. The software's world map feature includes various projections and layers for DXCC, IOTA, and WAZ, with a **double-clicking** function to turn the rotor, and provides accurate propagation predictions. It also supports multiple callbook and QSL manager databases, including QRZ and HamCall, and offers _multilanguage_ support in English, French, German, Italian, Portuguese, and Spanish.
 -
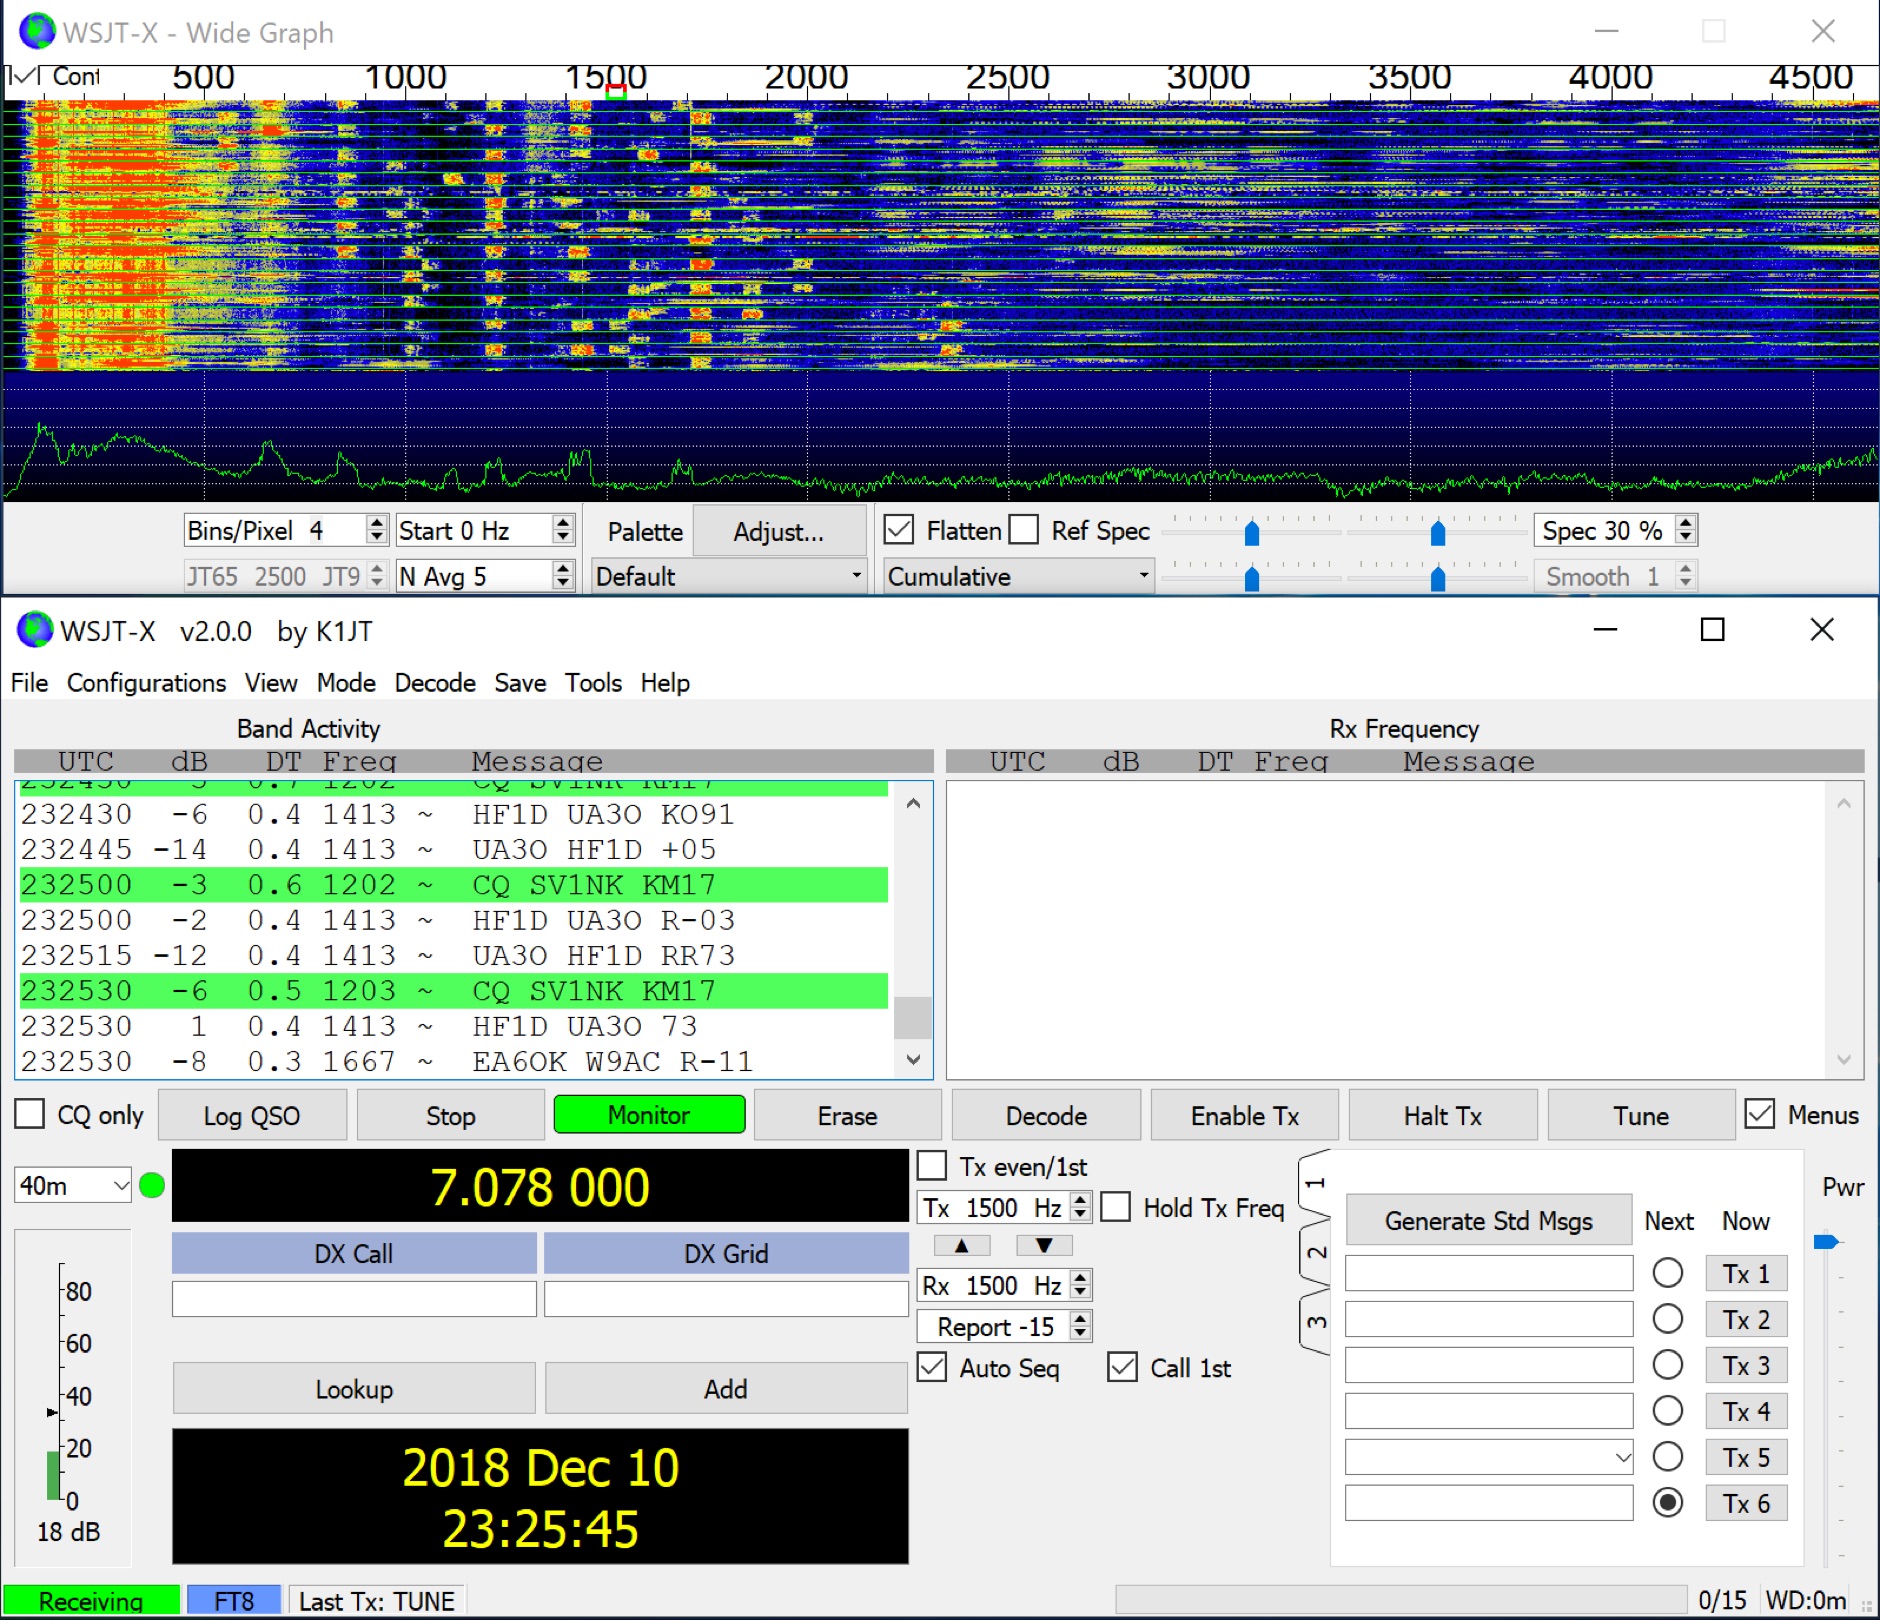 WSJT-X implements communication protocols including FST4, FST4W, FT4, FT8, JT4, JT9, JT65, Q65, MSK144, WSPR, and Echo. These modes facilitate reliable, confirmed QSOs under extreme weak-signal conditions. JT4, JT9, and JT65 utilize a nearly identical message structure and source encoding, employing timed **60-second** transmit/receive sequences synchronized with UTC. JT4 and JT65 are designed for EME on VHF/UHF/microwave bands, while JT9 is optimized for MF and HF, offering **2 dB** greater sensitivity than JT65 with less than 10% of its bandwidth. Q65 provides submodes with varying T/R sequence lengths and tone spacings, suitable for EME, ionospheric scatter, and weak signal operations on VHF, UHF, and microwave. FT4 and FT8 operate with T/R cycles of 7.5 and 15 seconds, respectively, supporting enhanced message formats for nonstandard callsigns and contest operations. MSK144 is engineered for Meteor Scatter on VHF bands. FST4 and FST4W target LF and MF bands, achieving fundamental sensitivities near theoretical limits for information throughput; FST4 is for two-way QSOs, and FST4W for quasi-beacon WSPR-style transmissions, without requiring the strict time synchronization of protocols like _EbNaut_. WSPR mode enables propagation path probing via low-power transmissions, incorporating programmable band-hopping. The **WSJT-X 2.7** General Availability release introduces the QMAP program, Q65 Pileup, SuperFox mode, a Hamlib update option, and a Message System. SuperFox mode transmits simultaneously to up to 9 Hounds with a constant envelope waveform, providing approximately +10 dB system gain compared to older Fox-and-Hound operations. _WSJT-X 2.7_ for _Windows_ platforms includes _MAP65 3.0_, a wideband polarization-matching tool for EME. The **WSJT-X 3.0.0-rc1** candidate release represents a major revision with new features, some ported from _WSJT-X Improved_. This software is available for _Windows 7_ and later (32-bit/64-bit), various Linux distributions (Debian, Ubuntu, Fedora, RedHat, Raspberry Pi OS), and macOS (10.13 through 15). DXZone Focus: Weak Signal | Digital Modes | WSJT-X | Windows
 -
 Radiomobile is an excellent and very detailed radio path mapping software, vhf uhf propagation predictor. This windows free software is a tool used to predict the performance of a radio system.
 -
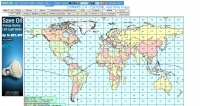
 A large jpeg DX World map that include ITU Zones, grid squares and prefixes. This high-resolution DX World Map is an essential tool for amateur radio operators. It clearly displays ITU zones, CQ zones, grid squares (Maidenhead Locator), and DXCC prefixes, helping you to plan QSOs, track propagation paths, and participate in global contests. Whether you are a seasoned DXer or a beginner, this map provides a clear, detailed view of the radio world, improving your station's efficiency and geographic awareness. Available in JPEG format, it's perfect for display
 -
 Create Online Maps, Check Forcasts and Conditions, more features being added each month, by hfradio.org
 -
 DXMaps.com presents a dynamic, real-time mapping service for amateur radio DX spots, integrating data from traditional DX clusters, _PSK Reporter_, and WSPR networks. The platform visually plots global QSO and SWL activity, enabling users to observe propagation conditions across various bands, from 2200m to >450 MHz. It offers distinct overlays such as the magnetic equator, gray line, moon footprint for EME, and VOACAP propagation predictions, providing a comprehensive view of radio wave behavior. The service allows granular filtering of displayed spots, including options to show only DX-Cluster data, PSK Reporter activity, or WSPR signals. Users can refine the map view by selecting specific bands (e.g., 160m, 20m, 6m, 2m), limiting spots to the last 15 minutes, or displaying only contacts exceeding **2600 km**. Additional features include the ability to toggle grid squares, aurora forecasts, and various amateur radio zones (CQ, ITU). Distinctively, the resource updates automatically every minute, ensuring current propagation intelligence without manual refresh. It also supports specialized views for EME, ionospheric scatter, and aircraft scatter, alongside FM DX and APRS activity. The platform emphasizes the importance of accurate locator information in DX spots to enhance data quality and offers a user manual and FAQ for guidance.
 -
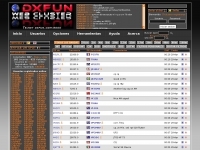 Demonstrates a **DX cluster** web service providing real-time amateur radio spot reports, propagation information, and solar data. The platform integrates features such as a gray line map, **DXCC** tracking, and a personal logbook, allowing users to manage their confirmed entities and contacts. It supports various bands from 160m to 70cm, including specific filters for modes like FT8/FT4, and offers both web and Telnet access for spotting and monitoring. The service provides graphical representations of spot reports, detailing activity across different frequency bands and modes (CW, SSB, digital). Registered users gain access to advanced functionalities, including personalized filters and tools for calculating DXCC status. The platform also includes a classifieds section and options for mobile access, catering to a broad range of amateur radio operators interested in DXing and contesting.
 -
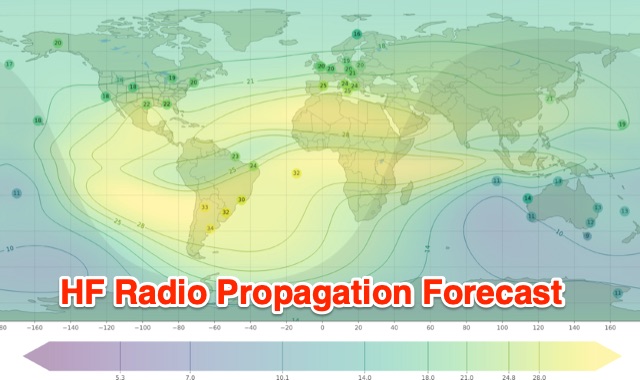
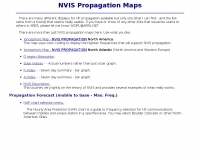
 These pages provide general propagation advice for HF communicators. Information available includes inferred global propagation conditions, real time HF fadeout coverage charts, regional ionospheric vertical MUF maps and Hourly Area Prediction charts for Astralia and Asia, Europe and North America
 -
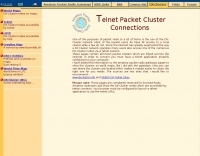 Illustrates the global distribution of **DX-Cluster** nodes through an interactive map interface, enabling radio amateurs to visualize and access real-time DX spots. The resource provides direct TELNET and HYPER links for each node, facilitating immediate connection to various clusters for up-to-the-minute propagation information and station activity. This visual approach simplifies the process of locating and connecting to a suitable DX-Cluster, whether for local or international DXing. Amateurs can use this tool to quickly identify active clusters in different geographic regions, which is particularly useful for **DXpedition** planning or contest operations. The direct links streamline access, bypassing manual configuration for many cluster types. It serves as a practical aid for operators seeking to monitor band conditions, find rare DX, or participate in competitive operating events by leveraging aggregated spotting data.
 -
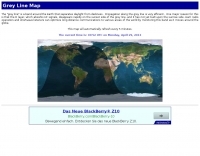 A greyline map that automatically refreshes every five minutes DX.QSL.NET
 -
 Understanding high-frequency (HF) skywave propagation is crucial for amateur radio operators seeking to optimize long-distance communications. This resource details the fundamental principles of HF radio propagation, including the properties of electromagnetic waves, the characteristics of various HF bands, and distinct propagation modes such as skywave, ground wave, and line-of-sight. It places significant emphasis on the ionosphere's pivotal role in refracting HF waves, explaining how solar activity directly influences ionospheric conditions and, consequently, propagation paths. The resource integrates real-time monitoring capabilities, featuring dynamic charts and data from DX clusters, WSPRnet, and the Reverse Beacon Network, which allow users to track current band activity and propagation conditions globally. It also delves into advanced topics like Near Vertical Incidence Skywave (NVIS) and gray line propagation, providing insights into ionosonde data and various propagation prediction models. The site presents a detailed analysis of solar-terrestrial interactions, geomagnetic indices, and space weather phenomena, illustrating their direct impact on HF communication reliability. Practical tools and applications are highlighted, including real-time QSO planners, online Maximum Usable Frequency (MUF) maps, and alerts for solar flares or geomagnetic storms. The guide systematically breaks down complex concepts into accessible chapters, offering a structured approach to learning about ionospheric regions, diurnal and seasonal effects, and the interpretation of propagation indicators like foF2, MUF, and Lowest Usable Frequency (LUF). This makes it a robust reference for hams aiming to deepen their technical understanding and improve operational effectiveness.
 -
 VHF/UHF DX site showing latest propagation, software, radio dealers, awards, maps etc.
 -
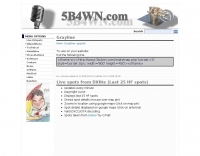
 VQLog 3.1 - 782 is a shareware logbook program designed for Windows operating systems (95, 98, NT, 2000, ME, XP, Vista, 7, 10, or later), supporting resolutions of 800x600 or higher. It can also operate on macOS and Linux via virtualization software like Virtual PC for MAC, Oracle VirtualBox, or VMware. The software facilitates QSO access by date, callsign, prefix, square, DXCC, and other parameters, offering robust import capabilities for ADIF, Cabrillo, and ASCII files from various contest and logbook programs. Key features include comprehensive award tracking for DXCC, WAZ, WAC, WPX, WAS, IOTA, TPEA, DIE, VUCC, 100EACW, and up to 30 user-defined awards. It generates customizable summaries and graphical statistics for QSO activity, DX contests, Most Wanted Squares (MWS), propagation openings, and prefixes. VQLog supports DX-Spot reception and processing from DX-Cluster and PSK-Reporter with programmable warnings, integrates with callbook services like QRZ.COM and Buckmaster's CD, and offers online lookup. Electronic QSL and log upload support extends to LoTW, eQSL.cc, Clublog, and DXMAPS, with real-time updates for online logs. The program provides extended QSO information for VHF-DXers, including separate TX/RX frequencies, start/end times, propagation modes, and specific entry fields for MS, EME, and Tropo. CAT support for rig control and interfaces with ARSWIN and PstRotator for azimuth/elevation control are also included.
 -
 The OK DX Club website serves as the home site for the OK DX Club, providing a variety of information such as hot news, propagation details, maps, QSL managers, software recommendations, useful links, and membership information. The site caters to amateur radio operators interested in DXing and offers a platform to share experiences, learn from fellow hams, and explore the world of DXing. The content is regularly updated to provide the latest information and resources for the amateur radio community.
 -
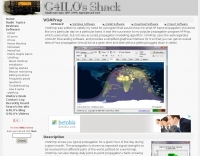 VOAProp shows you typical propagation for a given hour of the day during a given month. The propagation is shown as expected signal strengths to be received from different parts of the world, plotted on a world map. Windows freeware by G4ILO
 -
 A comprehensive resource center with DX aids, live propagation, callsign searches, news and bulletins, maps, and more by NW7US
 -
 DX Propagation by DR2W! High resolution SNR maps in pseudo color. Propagation based on the actual sunspot number.
 -
-
 Live DX spots are presented through a _web cluster_ interface, utilizing both a world map and a Google Maps display for visualizing amateur radio propagation. The system provides real-time spotting data, enabling operators to track active stations globally. Users can observe current band conditions and station activity, which is crucial for optimizing contact strategies across various amateur bands. The platform's utility extends to contest operations and general DXing, offering a visual representation of where stations are being heard. While the primary function is DX spotting, the site also includes technical articles, such as instructions for interlocking two Flex Radios for single-transmitter compliance in contests, and a guide for constructing a simple **5KW** 1:1 balun for **160m/80m** dipoles using RG400 cable. This combination of live data and practical technical content supports both operational awareness and station improvement.
 -
 The 3Y0K Log Online provides a detailed logsearch interface for the **3Y0K** DXpedition to Bouvet Island, scheduled for February 2026. This web-based tool, hosted on _Club Log_, allows users to access real-time QSO statistics and leaderboards. The interface includes interactive features such as a map for checking real-time propagation and colored boxes that reveal mode and time breakdowns when hovered over. The service supports HF bands and provides a structured overview of QSOs, including band/mode breakdowns and continent-specific data. Users can report logging inquiries and QSL requests exclusively through the M0OXO Online QSL Request System (**OQRS**). The site also offers additional resources like band plans, operating practices, and FT8 advice. The leaderboard feature, which includes clubs and Contest Club, ranks stations based on the number of band slots worked, with duplicate QSOs being discouraged. The expedition's impact on users' totals is also tracked, providing insights into new bands, modes, and DXCC entities worked. DXZone Focus: 3Y0K DXpedition | Club Log | Bouvet Island
 -
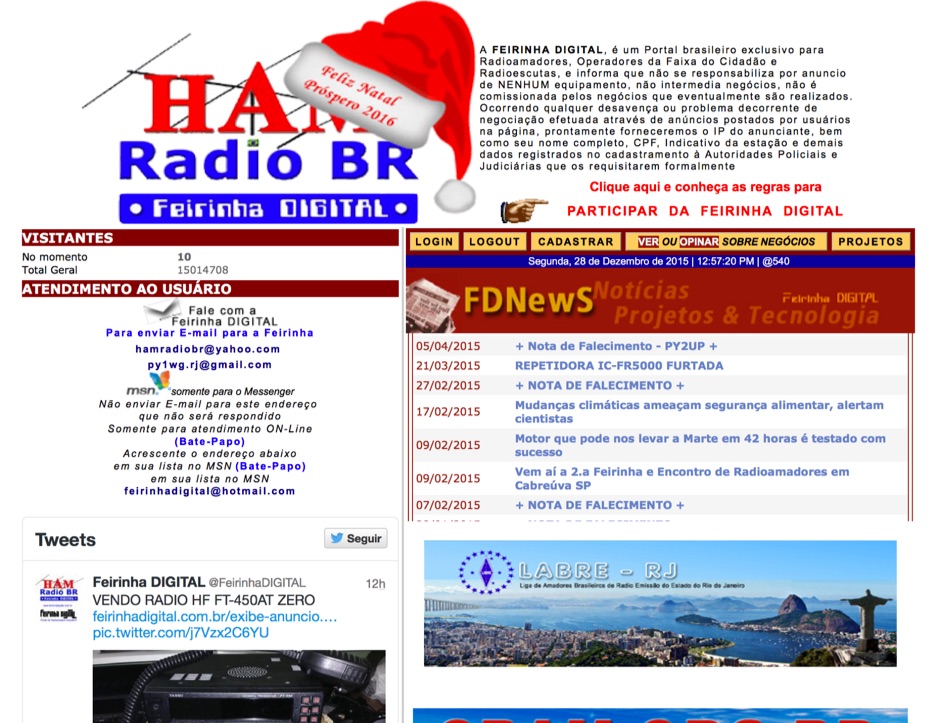 Presents a Brazilian online portal dedicated to **amateur radio**, **CB radio**, and shortwave listening (SWL) communities. The platform facilitates free classified advertisements for radio equipment, including HF, VHF, and UHF transceivers, antennas, and accessories. It also aggregates a substantial collection of technical articles from Brazilian amateur radio operators (e.g., PY2DJW, PY1LJ, PY1LL/4LC), covering topics such as CW training with RufzXP, balun importance, and radio wave characteristics. Furthermore, the resource provides extensive links to Brazilian ham radio sites, clubs, international organizations, and official ANATEL (Brazilian National Telecommunications Agency) documents regarding licensing, equipment homologation, and regulations. The portal features sections for user evaluations of transactions, a "Top Ten" list of most visited pages, and a calendar of past and upcoming ham radio events across Brazil, including "Feirinhas" (local swap meets) and "Encontros de Radioamadores" (hamfests). It also includes a directory of ham radio related businesses and services in Brazil, such as antenna manufacturers (Diex), QSL card printers (Arte Final), and repair technicians (PY2MOK). The site also offers propagation maps, DX cluster links (e.g., DX-SUMMIT), and satellite tracking tools, making it a central hub for Brazilian radio amateurs seeking to buy, sell, learn, or connect with the community.
 -
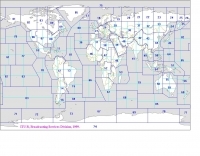 Explore this high-resolution ITU Zones Map, a critical reference resource for amateur radio operators, international broadcasters, and telecommunications engineers. Originally established by the International Telecommunication Union – Radiocommunication Sector (ITU-R) Broadcasting Services Division (1999), this chart accurately divides the globe into 90 specific CIRAF zones. This authoritative visual guide is indispensable for planning High Frequency (HF) radio propagation, scheduling international broadcasts, and verifying locations for radio contests and awards. Distinct from the 40 CQ Zones, the ITU zoning system provides the official administrative framework used for global frequency management. This digitally enhanced version ensures maximum clarity of zone boundaries and numbering (e.g., Zone 28 for Central Europe), making it an essential tool for technical accuracy in logbooks and station management. It serves as a trustworthy standard for educators, hobbyists, and industry professionals alike.
 -
 Presents the Holy Cluster, a contemporary DX cluster service offering real-time amateur radio spot data. This platform integrates a dynamic graphical map to visualize current contacts, enhancing situational awareness for DXers and contesters. Developed by an Israeli group of developers and supported by the Israeli Association of Radio Communication (IARC), the Holy Cluster aggregates DX spots from various sources, including traditional telnet clusters, the Reverse Beacon Network (RBN), and PSK Reporter, providing a comprehensive view of band activity. The cluster's design emphasizes a user-friendly interface for monitoring DX activity across multiple bands, including dedicated support for JOTA (Jamboree On The Air) operations. Its aggregation capabilities allow operators to quickly identify propagation openings and active stations, streamlining the process of making two-way radio contacts. The integration of RBN and PSK Reporter data offers insights into propagation conditions and station reception reports, which can be invaluable for optimizing antenna direction and operating strategies.
 -
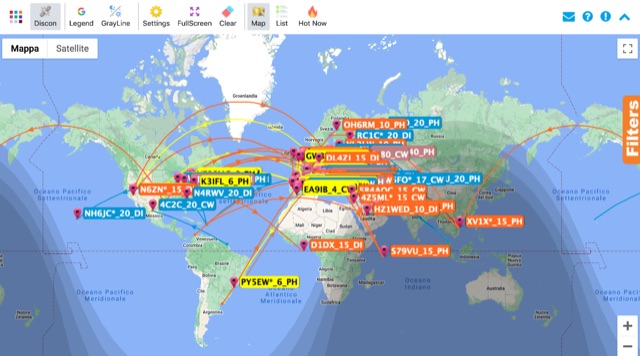 Monitoring real-time amateur radio activity is essential for DXers and contesters seeking rare contacts or tracking propagation. This online service aggregates DX spots from various **DX Cluster** networks, presenting them visually on a world map. Users can observe new spots as they appear, facilitating quick identification of active stations and potential openings. The platform offers filtering capabilities, allowing operators to narrow down displayed spots by specific bands such as 160m, 80m, 40m, 20m, 10m, and even VHF/UHF segments like 70cm and 23cm. Further refinement is possible by selecting the source continent of the spotter or the continent of the DX station, which assists in strategic operating. The service also includes a "Hot Now" list, highlighting currently active stations with recent spots. This dynamic display supports informed decision-making for pursuing **DX contacts** across different bands and geographical regions.
 -
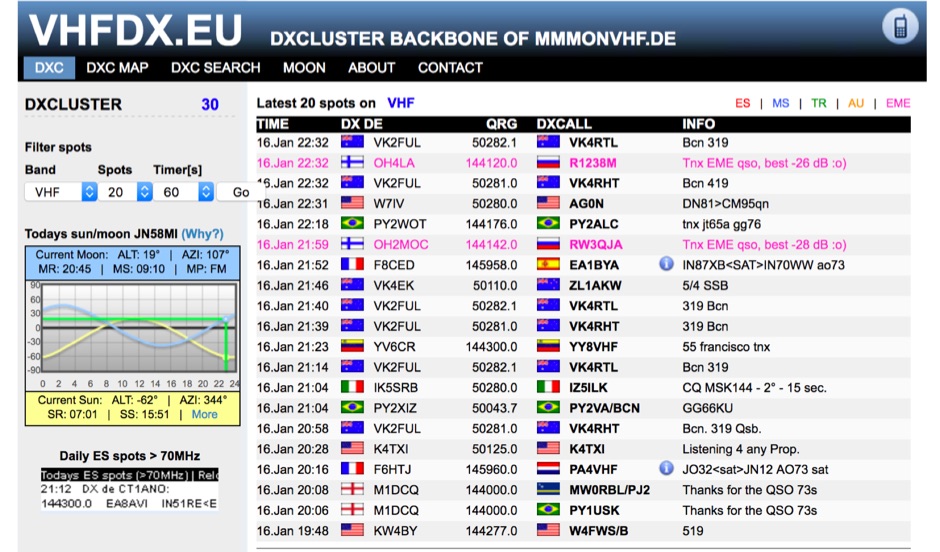 Presents the VHFDX.EU web cluster, a specialized resource for VHF, UHF, and microwave DX spotting. It details the cluster's functionality, including real-time spot aggregation and a DXCluster Map interface for visualizing activity. The resource highlights its integration with the MMMonVHF backbone, ensuring a robust data flow for monitoring band openings and propagation events across higher frequencies. It also references reviews of the ON4KST and N0UK chat systems, which are frequently used in conjunction with VHF DX operations. The platform offers a mobile-optimized view for on-the-go access to DX spots, catering to portable and mobile operators. It further provides daily ES (Sporadic E) spot summaries, a critical feature for VHF operators tracking this specific propagation mode. The cluster serves as a central point for operators to share and receive information on rare grid squares, contest activity, and general band conditions above 50 MHz.
 -
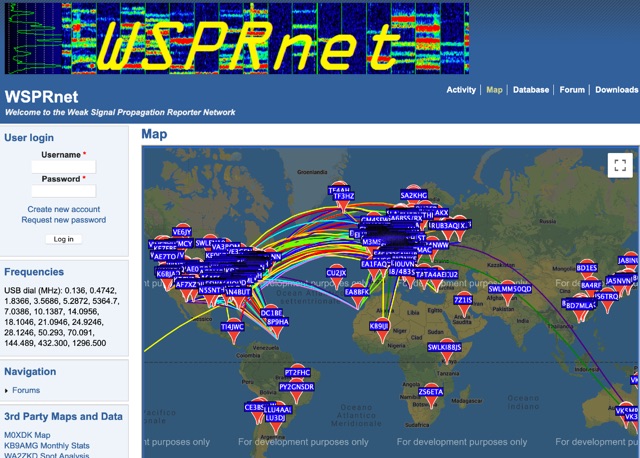 Weak Signal Propagation Reporter Network Map and Database of WSPR data
 -
 The Reverse Beacon Network (RBN) graph presents a dynamic visualization of amateur radio spots, specifically tracking CW, BPSK, and RTTY signals over the last 15 minutes. Users can filter these real-time spots by DX continent, spotter continent, and individual frequency bands, including **160m through 70cm**. The interface also offers a bandwidth reduction option, which is particularly useful for operators with limited internet connectivity. This resource provides a unique perspective on propagation conditions and station performance by aggregating data from various _Reverse Beacon Network_ nodes. It automatically refreshes every 10 seconds, ensuring that the displayed information is current and relevant for active DXers and contesters. The graph's Y-axis represents time, with each spot indicating activity within a one-minute interval. Beyond the primary RBN graph, the platform also features dedicated maps for both DXCluster and RBN data, including azimuthal projections. An additional FT8 graph is available, though noted as being under construction, indicating ongoing development to expand its utility for digital mode enthusiasts. The system was developed by HA8TKS, with the initial concept attributed to CT1BOH.
 -
 A 2x3-foot laminated world map product is detailed, offering customization for amateur radio operators. Each map features two distinct views: one centered on the operator's specific station location and another precisely centered on its _antipode_. Countries are clearly labeled, complemented by a tabular listing of all countries. The map integrates a standard latitude/longitude grid alongside concentric circles that delineate distance increments radiating outward from the operator's QTH. Personalization includes the operator's name, callsign, and location printed directly on the map. This custom mapping service provides a unique visual aid for DXing and propagation analysis, allowing operators to quickly ascertain beam headings and distances from their station. The dual-view presentation, particularly the antipodal centering, offers a practical reference for understanding long-path propagation and identifying potential DX opportunities. The inclusion of distance circles and personalized station data makes it a tailored tool for daily operating and contest planning, distinct from generic world maps.
 -
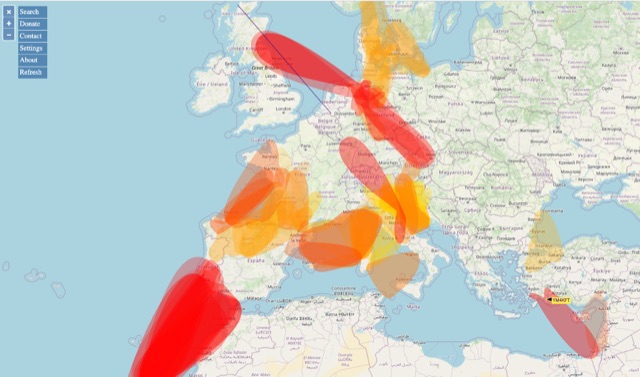 VHF – Based on realtime APRS reports. This map shows real-time radio propagation from stations operated near 144 MHz. It uses data gathered by Automatic Packet Reporting System-Internet Service (APRS-IS) from packet stations in the amateur radio service. The map shows activity from the past hour. Paths are smoothed to create a color-coded footprint indicating the distance VHF signals are likely to be traveling.
 -
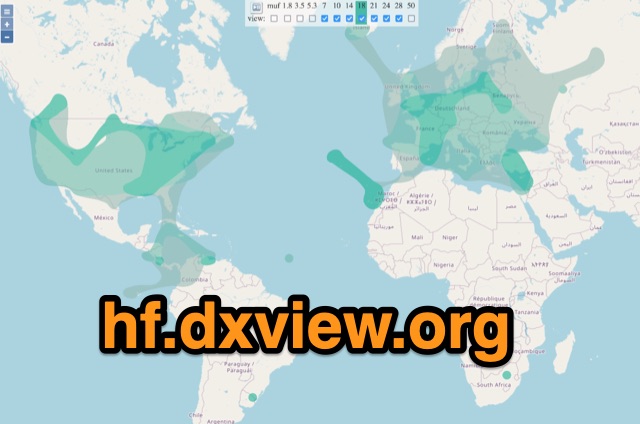 This map shows real-time radio propagation from stations operating on 11 bands between 1.8 and 54 MHz in the amateur radio service. The display shows world-wide activity from the last 15 minutes and is automatically updated about every minute. Data for the map is gathered from several online sources: WSPRnet, Reverse Beacon Network (CW, FT4, FT8), PskReporter, and DX Cluster.
 -
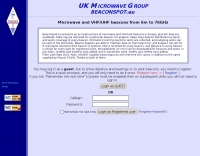 BeaconSpot.uk provides an accurate, real-time picture of microwave and VHF/UHF beacons operating across Europe, alongside a worldwide listing of 6-meter beacons. The platform allows users to retrieve detailed data for individual beacons, facilitating in-depth analysis of signal characteristics and propagation paths. Interactive maps visualize beacon distribution by frequency band and display spot coverage for each station, offering a clear geographical overview of active beacons. The system integrates real-time DXCluster spots, sourced from contributors like Alain, ON4KST, and Pascal, F5LEN, and enables users to submit outgoing spots directly to the DXCluster. Beacon keepers can manage their beacon data, receive email alerts upon being spotted, and track their station's ODX (Outstanding DX) records. For every received spot, the distance to the beacon is automatically calculated and displayed, aiding propagation studies.
 -
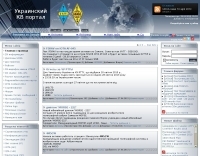 Ukrainian radioamateur on HF: DX News, Contesting, Propagation, Conference, Photo, Radioamateur Map, Online Logs etc.
 -
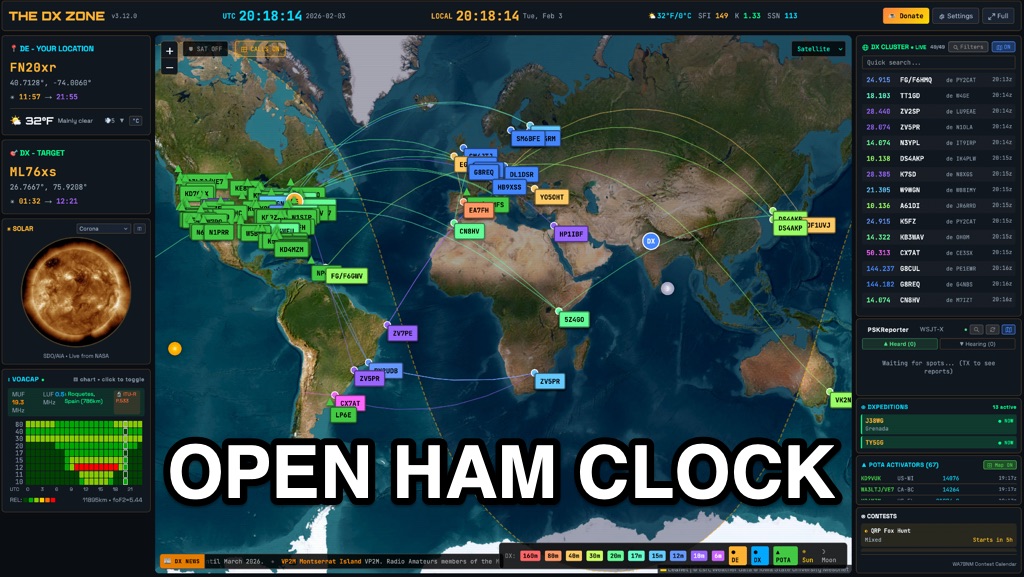 OpenHamClock is a modern, open-source dashboard for amateur radio operators, designed as a web-based successor to the original HamClock. Deployable locally on a Raspberry Pi or via the cloud, it centralizes essential DX operations into a single, intuitive interface. At its core is an interactive world map that visualizes real-time DX spots, signal paths, satellite tracking, and POTA activators. The software seamlessly integrates critical tools like WSJT-X, DX Cluster, and PSKReporter for monitoring digital traffic. Additionally, it provides vital environmental data, including real-time space weather indices, solar activity, and personalized HF propagation predictions. With customizable themes and a modular architecture, OpenHamClock offers modern operators comprehensive, at-a-glance situational awareness of global radio conditions
 -
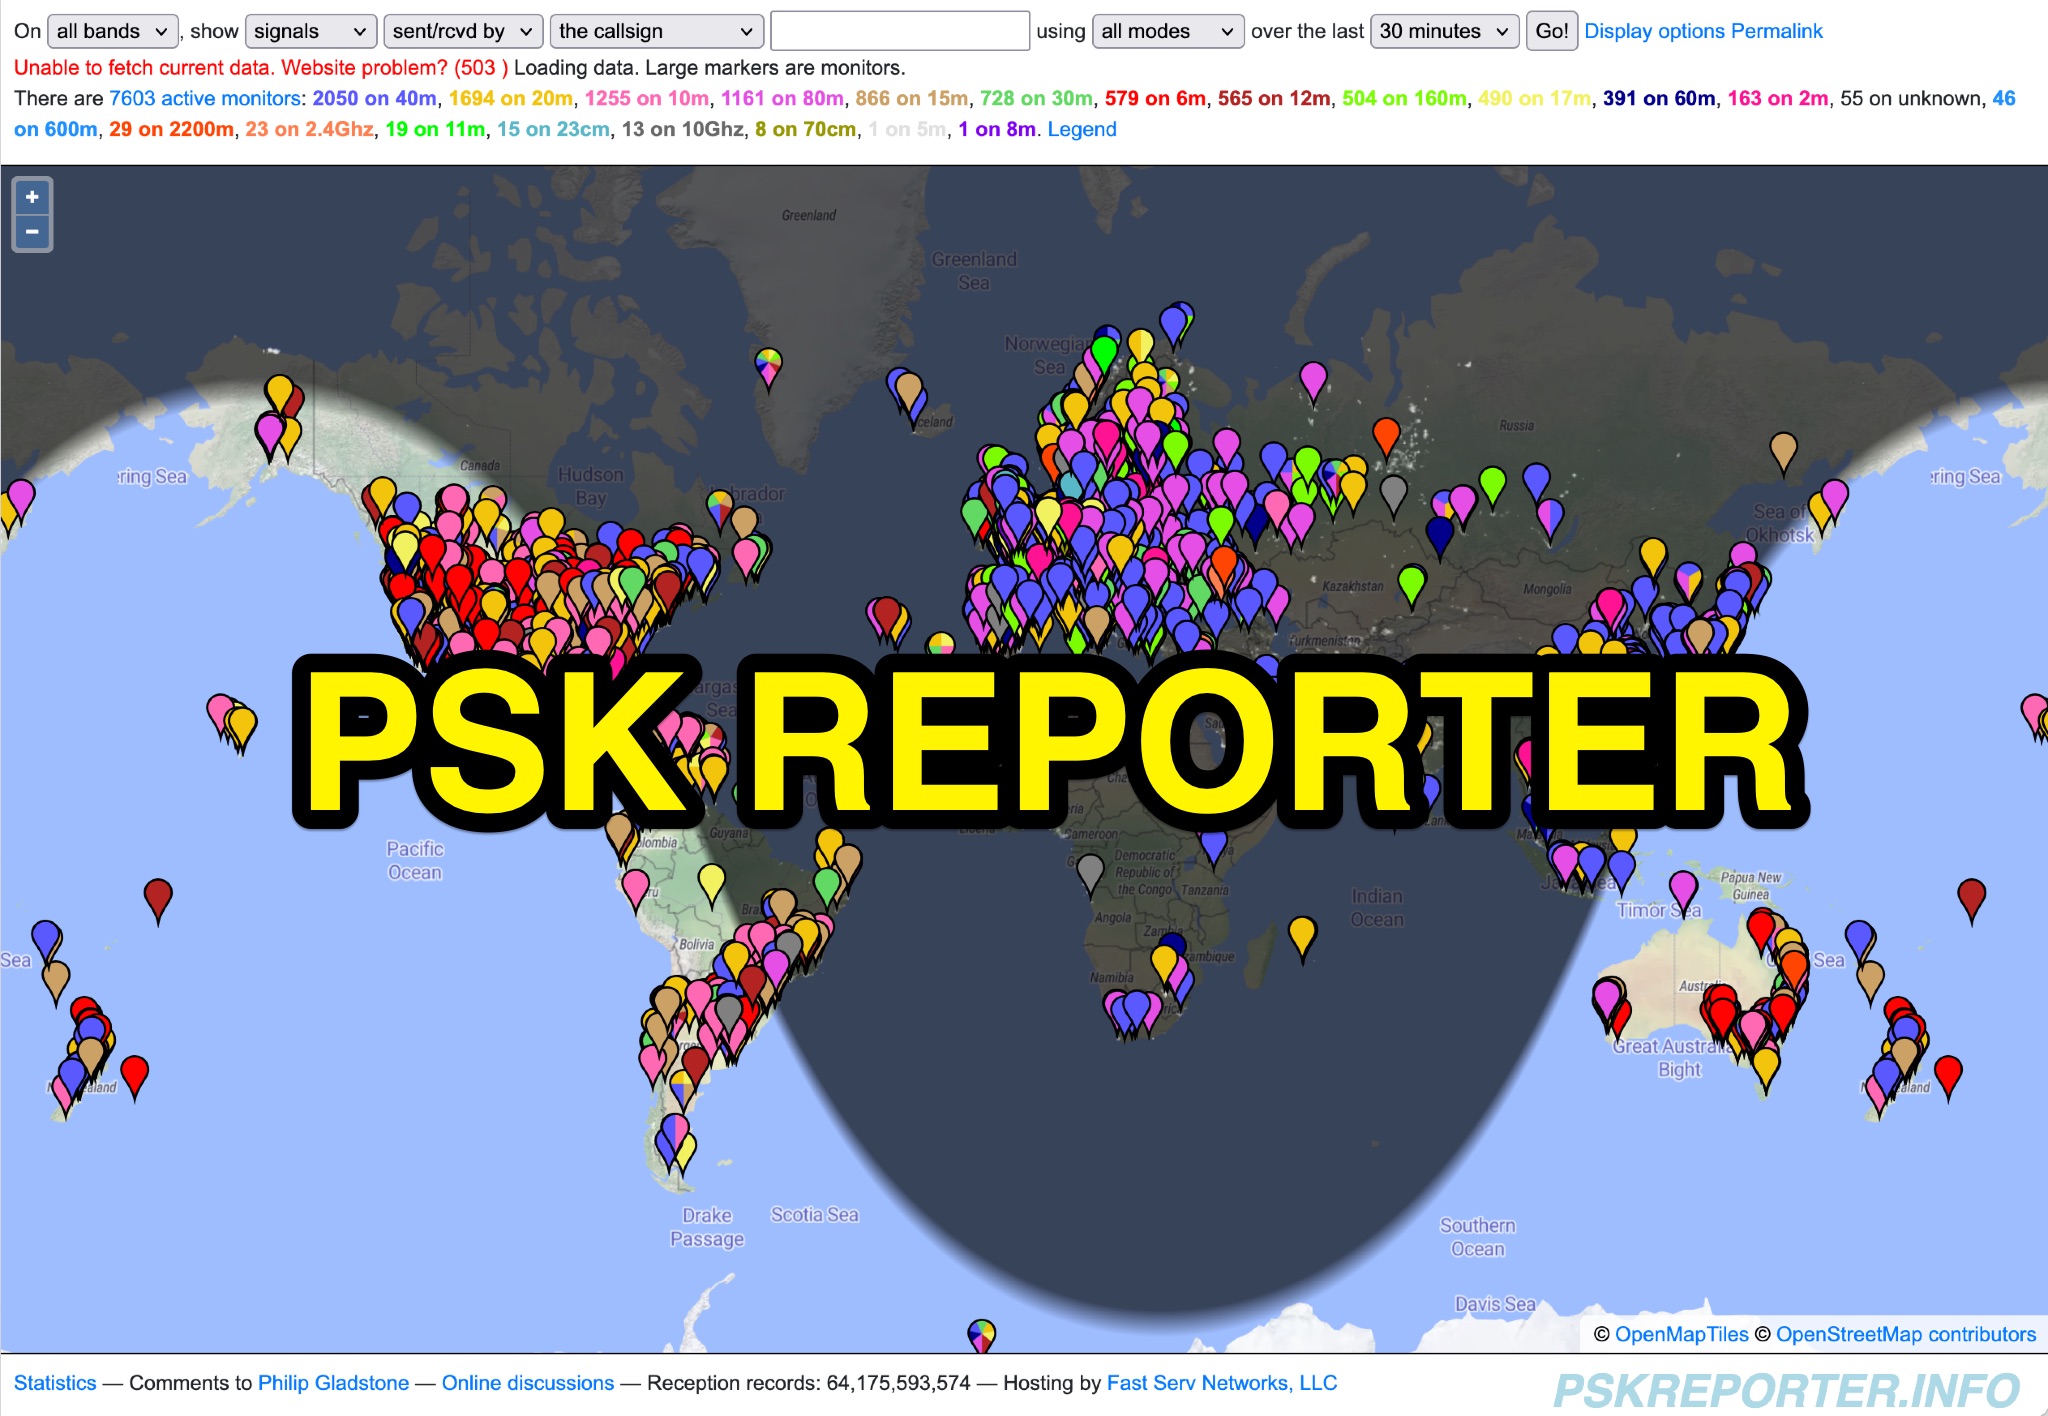 PSK Reporter provides a real-time visualization of amateur radio digital mode reception reports, aggregating data from a global network of monitoring stations. This platform is particularly useful for operators utilizing modes such as FT8, FT4, and PSK, allowing them to observe signal propagation paths and assess their station's reach. The interactive maps display reception reports, enabling hams to analyze band conditions and optimize antenna performance for various frequencies and times of day, aiding in understanding ionospheric conditions. Operators can filter reports by callsign, band, mode, and time, gaining insights into specific propagation events or evaluating the effectiveness of their transmit setup. The data collected helps in predicting optimal operating windows for DX contacts across various digital modes. Philip Gladstone is the contact person for comments and discussions regarding the system.
 -
 On March 27, 2017, the FCC adopted final rules for the USA 630-meter band, detailed in Report and Order FCC 17-33, which required PLC coordination with the Utilities Telecom Council before amateur operations could commence. This resource documents the WD2XSH experimental group's activities, including authorized stations, band plans, and frequency assignments within the 465-515 KHz range, with many stations operating between 495-499 KHz and 501-510 KHz. The site also highlights the WRC-12 decision on February 14, 2012, which granted a new **7-kilohertz-wide** secondary allocation between _472-479 kHz_ for the Amateur Radio Service worldwide. The group's efforts included operating with a maximum ERP of **20 Watts** across 45 stations in the continental USA, Alaska, and Hawaii, using emission modes such as CW, PSK-31, FSK-31, and MSK-31. The site provides links to download FCC 17-33 in PDF and DOCx formats, and offers a station location map, a list of stations by callsign and frequency, and an archive of news updates. Reception reports for any 600-meter station are encouraged to help the amateur radio community understand propagation and repeatability on this challenging band.
 -
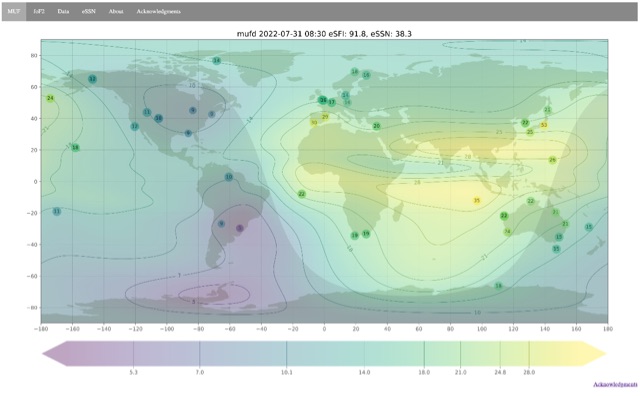 Ionospheric propagation maps MUF and critical frequency
 -
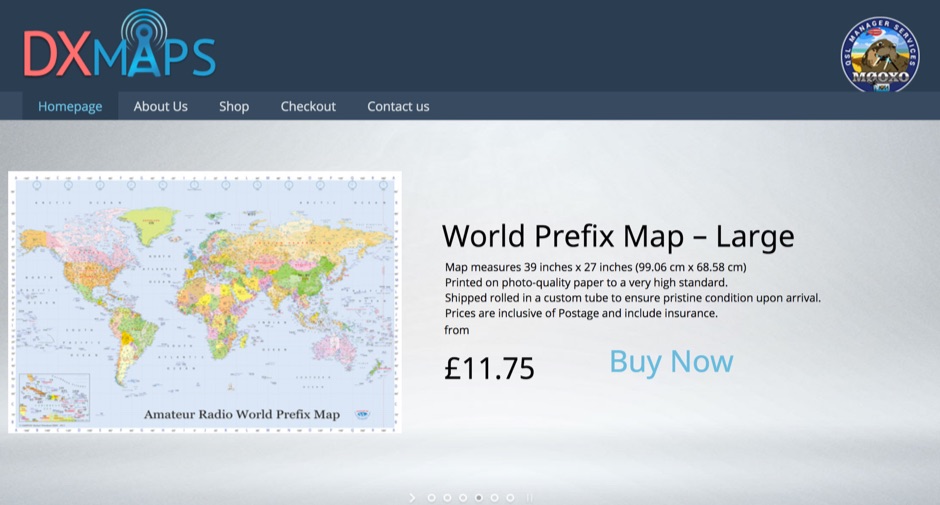 DX Maps provides a specialized map printing service, focusing on amateur radio applications such as world prefix maps and custom great circle projections. The platform allows radio operators to visualize propagation paths and DX entities relevant to their QTH and operational goals. This service supports the creation of high-quality, large-format maps tailored for shack display or operational planning. The service facilitates the generation of personalized maps, which can include specific callsign locations, beam headings, and other critical amateur radio data points. Users can specify parameters to create maps that aid in understanding global propagation conditions and optimizing antenna aiming for long-distance contacts. The UK-based operation ensures a localized service for European hams, with international shipping options available. DX Maps also offers QSL card printing, complementing its mapping services.
 -
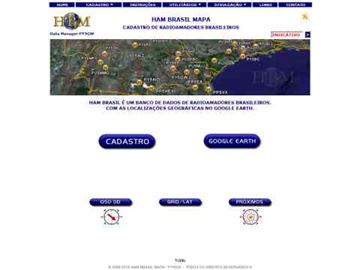 Approximately 524,475 Brazilian amateur radio operators are cataloged within this resource, offering a comprehensive database for the South American region. Each entry includes geographical coordinates, enabling users to visualize station locations directly within Google Earth. This functionality supports DXers in identifying potential contacts and understanding propagation paths relative to specific Brazilian QTHs. The platform serves as a digital callbook, primarily focused on the Brazilian amateur radio community. It facilitates the lookup of callsigns and associated location data, which is crucial for award tracking, contest planning, and general operational awareness. The integration with mapping services provides a visual dimension to traditional callsign databases, enhancing the utility for operators interested in geographical aspects of radio communication.
 -
 The Kentucky Contest Group (KCG) website, maintained by N4GN, serves as a hub for amateur radio operators interested in **radiosport** contesting within Kentucky and southern Indiana. It details the group's dedication to promoting contesting, offers links to KCG officers, membership rosters, and upcoming meetings, and provides access to an active KCG e-mail reflector and Facebook Group for member communication. The site also features a comprehensive list of N4GN's recommended ham radio web picks, covering various categories like contesting resources, DXing, VHF/UHF/Microwave, and propagation information. The KCG's map center coordinates were updated on May 16, 2015, shifting approximately 16.5 miles SSW to 37° 21' N, 85° 39' W. Despite acknowledging current inactivity and an outdated web presence, the group remains operational, exploring options for reorganization, including a potential merger with the Tennessee Contest Group (TCG), which was ultimately rejected. The site emphasizes that membership applications are considered from anyone with a genuine interest in contesting.
 -
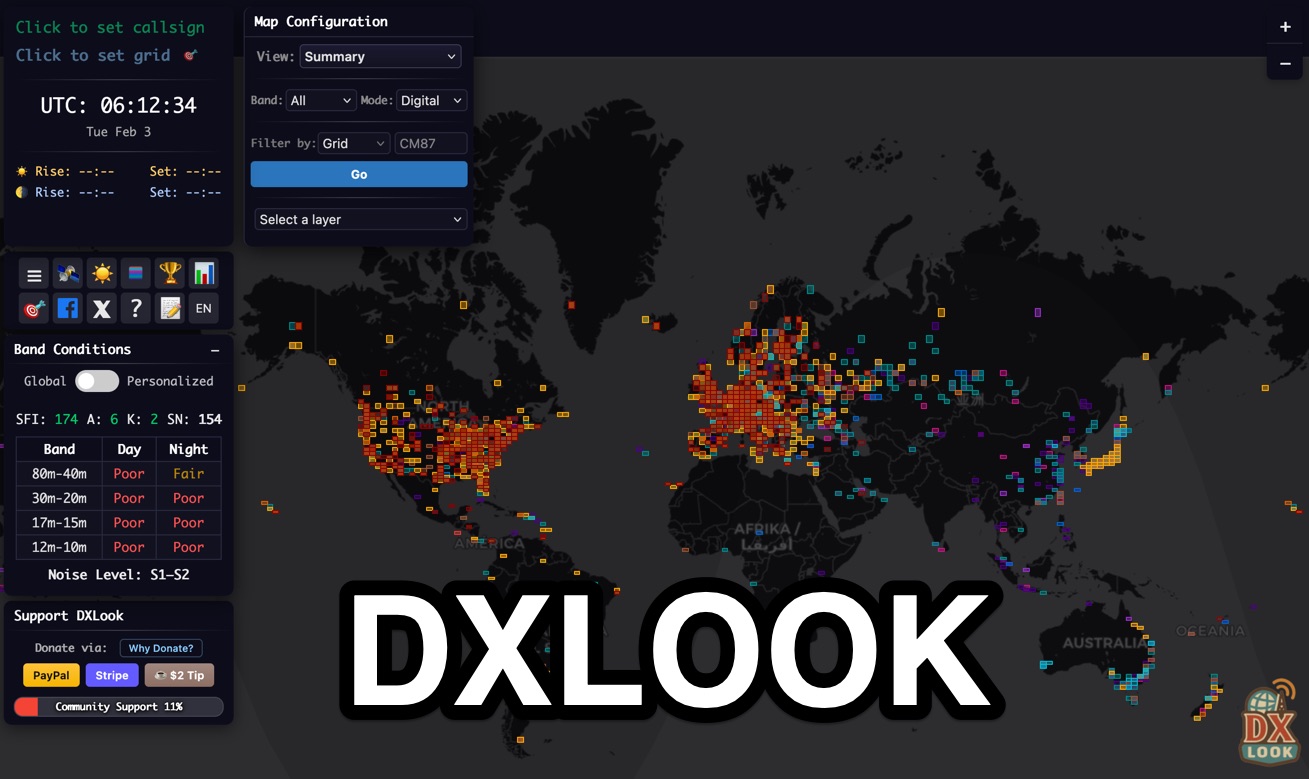 DXLook is a free, web-based propagation platform that delivers comprehensive, real-time insight into HF and VHF conditions directly from any modern browser. It aggregates live spots from PSK Reporter, WSPRnet, RBN, and DX Cluster, complemented by NOAA space-weather metrics such as SFI, K/A indices, and geomagnetic alerts. Integrated VOACAP predictions allow practical "theory versus reality" comparisons, while the interactive world map with filters, gray line, and grid overlays enhances situational awareness. With no installation or maintenance required, DXLook provides a convenient, accurate, and accessible solution for everyday operating and propagation analysis.
 -
 Over 150 pages of content are dedicated to maximizing activity on the 6-meter band, often referred to as the _Magic Band_. The resource details various propagation modes, including sporadic E, F2, and tropospheric ducting, providing insights into their characteristics and how to leverage them for DX contacts. It also covers essential equipment considerations, from transceivers and transverters to specific antenna designs optimized for 50 MHz operation, such as Yagis and Moxon antennas. The eBook presents strategies for participating in 6-meter contests and pursuing awards like _VUCC_, offering practical advice on logging software and operating techniques. It includes discussions on software tools useful for predicting propagation and managing contacts, alongside guidance on finding and utilizing DX maps to identify openings. The author, K5ND, shares his extensive experience to help operators achieve successful 6-meter DXing. Specific sections address the code of practice for 50 MHz operations and provide assistance in locating rare DX opportunities. The content is structured to guide both new and experienced operators through the nuances of the band, from initial setup to advanced operating strategies.
 -
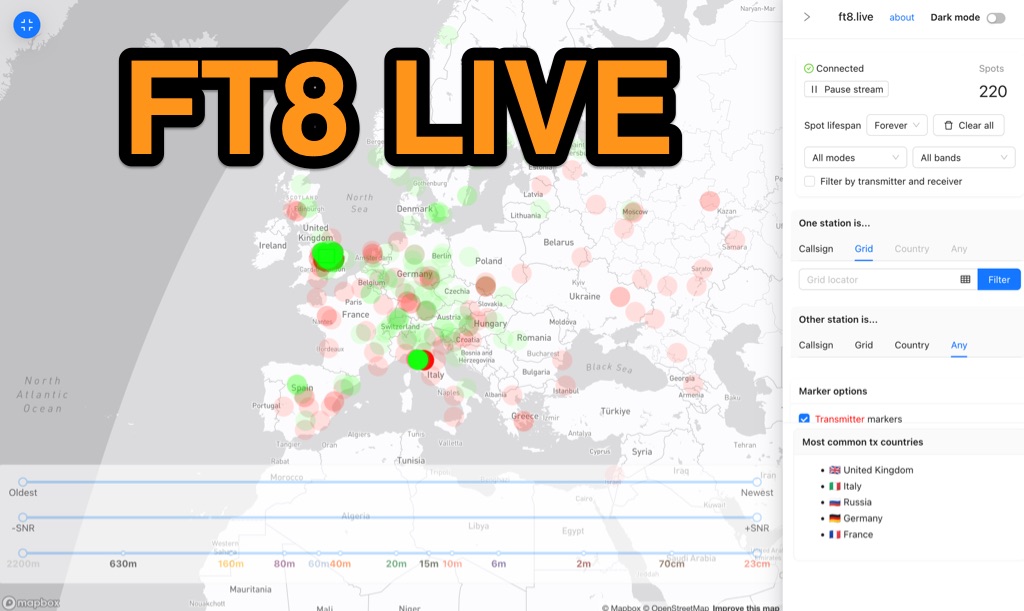 Visualizes real-time amateur radio propagation spots using data from the PSK Reporter MQTT stream, providing immediate situational awareness for radio operators. The platform displays spots from various modes, including CW, WSPR, and JT65, in addition to the dominant FT8 digital protocol. FT8 Live focuses exclusively on live data streams, prioritizing current signal activity over historical archiving, which differentiates it from the official PSK Reporter map. A key feature is its integration with the Summits on the Air (SOTA) API, facilitating SOTA chasing by cross-referencing transmitting callsigns with SOTA alerts; a station is identified as an activator if the spot correlates with a scheduled alert within an eight-hour window. The user interface was developed by Arron (ZL1AN), with core data from Philip Gladstone (N1DQ), and stream delivery managed by Tom Stanton (M0LTE).
 -
 Accessing current operational statistics for a DXpedition is crucial for DXers planning their next contact. This Club Log page provides a detailed, real-time overview of the 3Y0J Bouvet Island operation, a highly sought-after DXCC entity. It presents a dynamic dashboard showing total QSOs, unique calls worked, and duplicate contacts, all updated as logs are uploaded from the remote location. Users can observe the expedition's progress and strategize their operating times. The interface features interactive charts and graphs, allowing operators to analyze the _3Y0J_ log data by band and mode, including CW, FT8, and SSB. A breakdown of QSOs by continent provides insight into propagation patterns and where the expedition has focused its efforts. The page also includes a map for checking real-time propagation conditions to Bouvet Island, which is invaluable for optimizing contact attempts. Further details include the first and last QSO times, total operating days, and the impact on users' DXCC totals, such as new bands, modes, or DXCC entities worked. This resource is a vital tool for the DX community, offering transparency and actionable intelligence for chasing one of the rarest entities on the air.
 -
 First released in 1988, _SWLog_ is a comprehensive suite of applications providing logging and remote control for both amateur radio and shortwave, utility, and broadcast listening. It integrates program schedules from sources like _HFCC_, _ILGRadio_, and _EiBi_ for broadcast reception, while also linking with amateur radio logbooks such as _ClubLog_, _eQSL_, _QRZ_, and _LoTW_. The software supports radio control for various transceivers, including _Flex_, Icom, Yaesu, and Kenwood, alongside interfaces like _FLRig_, _OmniRig_, and _HamLib_. Mobile applications for Android and iOS facilitate on-the-go logging and remote control, seamlessly transferring logs without manual ADIF export. _SWLog_ leverages an enterprise-grade relational database (SQL Server) for robust data management and analytics, enabling features like mapping QSOs by band or state. It offers specific integrations for _POTA_ monitoring, displaying active spots with real-time propagation and automatic radio tuning. The application's scalability allows multiple users to log to a centralized database, suitable for Field Day or DXpeditions. The user interface features modern aesthetics with light, dark, and gray themes, the latter optimized for outdoor visibility during activities like _POTA_ or _SOTA_. The Plus Edition, available for an annual fee, expands capabilities with advanced QSL integration, additional map providers, and enhanced propagation calculations using _VOACAP_.
 -
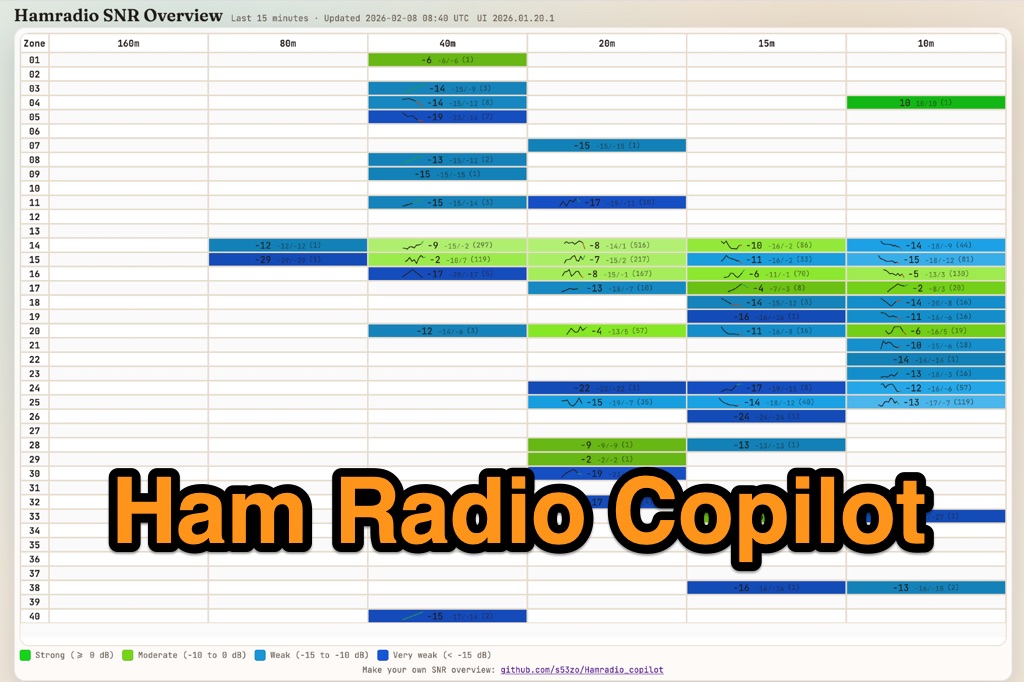 Hamradio_copilot is an open-source tool designed for DXers and contesters who need real-time situational awareness. It is ideal for operators who want to visualize propagation trends instantly rather than scrolling through raw text streams of cluster spots. Rally acting as a copilot for your station, this tool transforms raw data into actionable intelligence. By visualizing Signal-to-Noise Ratios (SNR) across different bands, it helps operators make quick decisions on which band to prioritize or where to point their antennas, effectively showing not just who is on air, but where the propagation is currently open from your location. This is a fantastic information for avid contesters. The software aggregates data from two primary services: - Reverse Beacon Network (RBN) via Telnet. - PSK Reporter via MQTT feeds. It processes this data to generate a comprehensive HTML report featuring SNR heatmaps and statistical breakdowns by ITU Zone. Users can filter data by specific zones or country codes (ADIF), analyze historic time ranges, and optionally integrate solar weather data. The complete source code is available on GitHub, allowing for community customization. It is written in Python and uses SQLite for data management.
 -
 Spotty leverages Philip Gladstone’s pskreporter.info data, delivered via an MQTT broker by Tom Fanning (M0LTE), to offer a responsive web application for visualizing propagation. The Map View presents a default visualization (grid AA00 / callsign MY8CALL) and distinguishes signal types: small spots for signals heard by a location, large spots for transmissions from a location, and teardrop markers for transmissions from the monitored callsign. Clicking a spot reveals detailed signal data in an overlay. The application includes a Log View for raw spot data and a Settings tab for customization. Users can filter tracking by specific Callsign or Grid, with preferences saved to the browser. A notable feature is the Time to Live (TTL) setting, adjustable from the default 60 seconds, which controls spot visibility duration to manage map clutter during high-traffic periods. The tool provides a clear, logic-driven interface for real-time signal monitoring.
 -
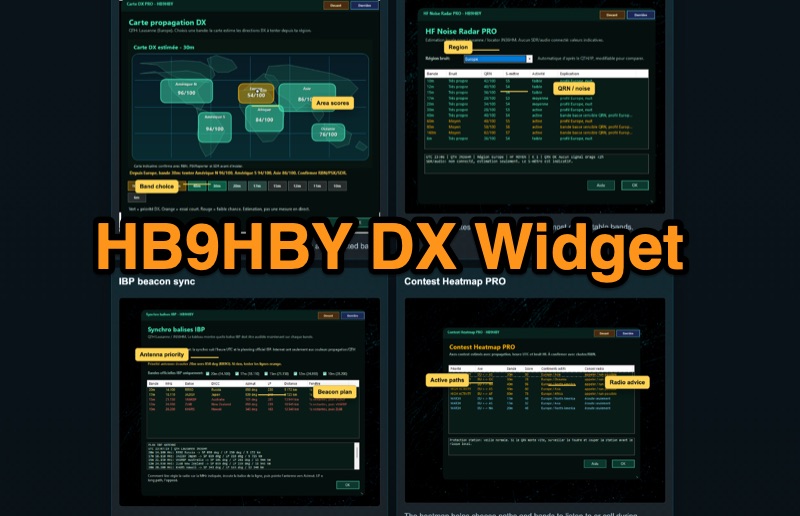 Demonstrates the _Widget DX HB9HBY_ software, a compact desktop application for amateur radio operators, providing essential real-time information. The widget displays UTC time, current HF propagation conditions, local weather, and thunderstorm risk. It also integrates radio-related links and offers advanced PRO functions, such as a DX map, HF noise radar, IBP beacon synchronization, contest heatmap, aurora radar, and a rare DX radar. The software is available for Windows 10/11 and Linux, with a macOS version planned for future release, and supports both French and English interfaces. Author HB9HBY highlights the widget's simple installation process and automatic update capabilities, which can be silent for minor fixes or include notifications for significant changes. The free version provides core functionalities, while a 15-day free trial unlocks the PRO features. A lifetime PRO license is available for a one-time payment of CHF 10, activating advanced tools that help operators make quicker decisions at the station by correlating propagation, UTC, DX activity, and local conditions, though results remain indicative and require confirmation via listening or tools like _RBN_ or _PSKReporter_.
 -
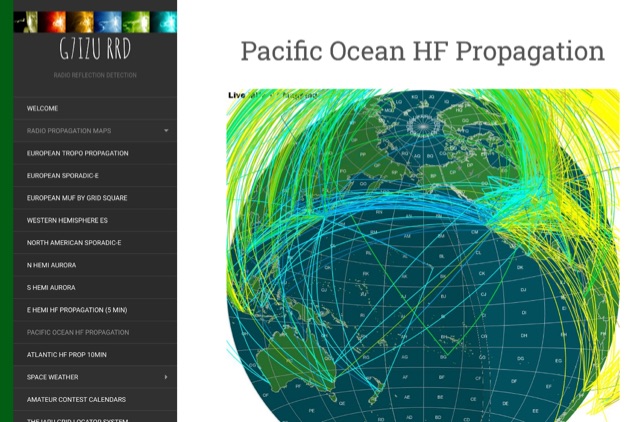 Welcome to the G7IZU Radio Reflection Detection website. This site provides also Live Solar Events, and propagation map
 -
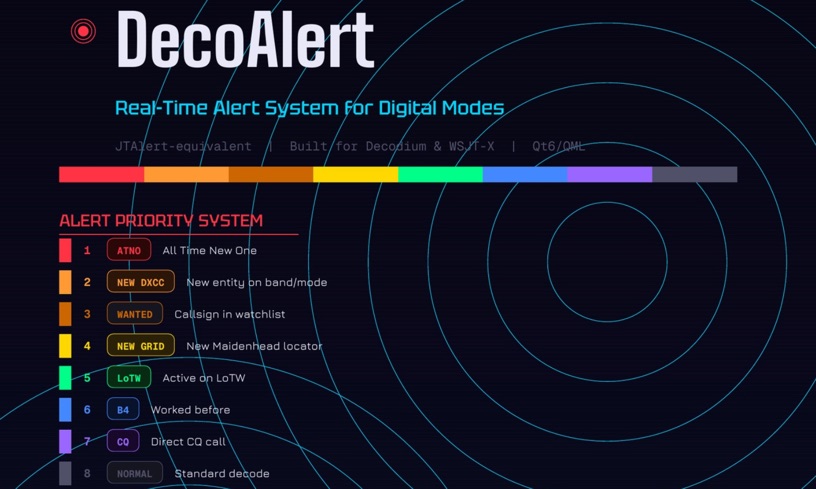 DecoAlert 1.0 Beta is a companion application designed to enhance the digital mode operating experience, specifically for FT8, FT4, and FT2. It operates by monitoring UDP data streams from primary decoding software like _Decodium_ and _WSJT-X_ on port 2237. The software provides real-time, priority-based audio alerts using WAV sounds for various conditions, including All Time New Ones (ATNO), new DXCC entities per band/mode, user-defined watchlist callsigns, new Maidenhead grid squares, and LoTW-active stations. It also highlights previously worked stations (B4) and integrates live DX spots from Telnet clusters, offering a comprehensive suite of tools for serious digital mode operators. The application features a built-in SQLite database for tracking worked stations and integrates with LoTW user lists to identify confirmed contacts. A DX Cluster client supports multiple Telnet servers, providing a broad view of propagation. PSKReporter statistics are available by band and mode, offering insights into signal paths. The QSO log viewer includes search and filter capabilities, while an _OpenStreetMap_ (OSM) interface visualizes spot locations, aiding in situational awareness. DecoAlert requires Windows 10/11 (64-bit) and compatible digital mode software configured to send UDP data.
 -
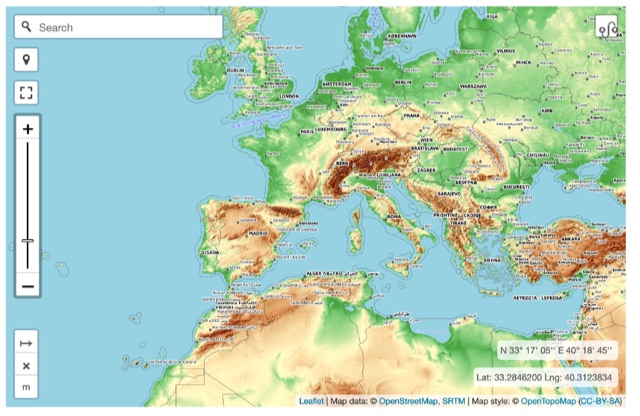 Online interactive elevationmap can help radio amateurs by predicting signal propagation, optimizing antenna placement, planning coverage, ensuring line-of-sight, mitigating interference, and enhancing emergency communication. T